Download
1 / 17
170 likes | 257 Views
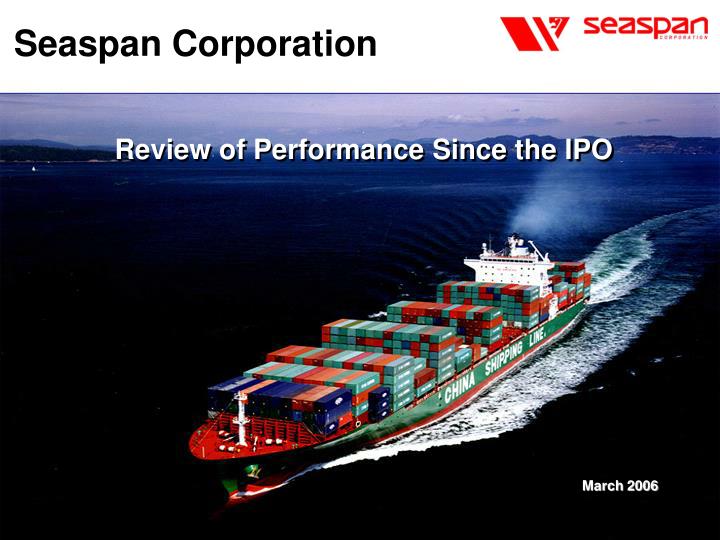
Seaspan Corporation. Review of Performance Since the IPO. March 2006.

E N D
Seaspan Corporation Review of Performance Since the IPO March 2006
This presentation contains certain statements that may be deemed to be “forward-looking statements” within the meaning of the Securities Acts. All statements, other than statements of historical facts, that address activities, events or developments that the Company expects, projects, believes or anticipates will or may occur in the future, including, without limitation, the outlook for fleet utilization and shipping rates, general industry conditions including bidding activity, future operating results of the Company’s vessels, capital expenditures, asset sales, expansion and growth opportunities, bank borrowings, financing activities and other such matters, are forward-looking statements. Although the Company believes that its expectations stated in this presentation are based on reasonable assumptions, actual results may differ from those projected in the forward-looking statements. For a more detailed discussion of risk factors, please refer to the Prospectus filed with the SEC on August 8, 2005 related to the Initial Public Offering. Notice on Forward Looking Statements
Who We are • We have built a world-class containership leasing company over the last 6 years • Through a disciplined and well-timed acquisition strategy we are currently the fifth largest independent containership charter owner • By 2009 we will be one of the largest companies in our industry (133,903 TEU) Announced post-IPO acquisition of 6 new vessels Seaspan formed First long-term charters with China Shipping (5 ships) At industry low, Seaspan signs large ship order for China Shipping Seaspan will own and operate at least 29 ships 1999 2000 2001 2002 2003 2004 2005 2006 2009 August 8, 2005 IPO of Seaspan (NYSE: SSW) Washington Group investment Ships placed with CP Ships
Container Shipping Value Chain Charter Owners Liner Operators Shippers • Own and operate vessels under long-term fixed-rate charters • Minimal risk to revenues, costs or utilization • Source cargo • Load and discharge containers • Vessel employment risk • Responsible for voyage expenses inc. fuel expense • Require movement of materials and finished goods through supply chain • Wal-Mart effect: • 9,000 out of 15,000 suppliers in China • Represents 18% of Transpacific trade Stable cash flows Strong but volatile cash flows
Seaspan Corporation IPO 2005 Americas Maritime Equity Deal of the Year – Marine Money Seaspan Firsts: • Largest U.S. listed shipping IPO ever • First IPO in the container ship leasing industry • First IPO of a C-Corp structured like an MLP Investment Highlights: • Long-term stable cash flows with 10+ year fixed rate charters • Successful throughout cycle with ability to make acquisitions in up and down markets • High growth potential given strong industry dynamics • Low residual risk and chartering upside • Attractive base dividend of 8.1% gives downside protection • Significant financial flexibility allows for competitive cost of capital • Large, uniform containership fleet provides operational flexibility • Strong management team and Washington Group sponsorship
Key Financial Characteristics • Stable cash flows from long-term fixed-rate charters • Locked in vessel operating costs • Interest rates fully hedged • No fuel price risk or foreign currency exposure • Multiple credit worthy counterparties • No corporate level income taxes • Cash flow retention for reinvestment • Subordination of dividends by founders • Ability to finance large scale vessel purchases • $1.0 billion credit facility and access to capital markets Highly predictable business model supports stable base dividend and provides platform for growth
Performance Since IPO We continued to deliver on our strategy and accomplished all of our key objectives since our IPO • Early delivery of vessels boosted distributable cashflow • Generated $22.6 million of cash flow available for distribution from IPO to December 31, 2005 • Dividends remain on-target with our projections • Paid a quarterly pro-rated dividend of $0.23 for the period ending September 30, 2005 • Declared an ordinary dividend of $0.425 per share for the first full quarter ended December 31, 2005 • Expanded fleet to 13 vessels in 2005 • CSCL Melbourne delivered four weeks ahead of schedule • CSCL Brisbane delivered four weeks ahead of schedule • CP Kanha delivered eight weeks ahead of schedule • Fleet 100% utilized during 2005 142-day operating period • Ahead of schedule for 2006 • Dubai Express delivered ten weeks ahead of schedule • Jakarta Express delivered seven weeks ahead of schedule • Beat consensus estimates in Q3 at $.14 per share and in line with estimates for Q4 at $.26 per share • Announced first acquisition of vessels not in the original contracted fleet Total Capacity (TEU) Fleet Growth = 41.7%
COSCON Acquisition – 3500 TEU Details of Acquisition Strategic Opportunities • Deliver incremental growth through fleet expansion • Diversify customer base by adding major and rapidly growing player in China, with potential to deliver further business in future • Entry into 2nd hand KG divestitures arena • Secure long-term time charters ensuring strong and stable cash flows for distributions • Establish relationship with growing Chinese shipbuilder • $5 million to $5.5 million incremental EBITDA per vessel per annum upon delivery
CSCL Asia Acquisition – 2500 TEU Details of Acquisition Strategic Opportunities • Expansion of fleet to include 2500 TEU vessels • Further solidifies relationship with high quality charterer • Uncommitted purchase option on 8 additional 2500 TEU vessels at the same purchase price • $4.4 million to $4.8 million incremental EBITDA per vessel per annum upon delivery
Well Positioned to Capitalize on Opportunities in Tougher Market Charter Rates Declining Significantly Since Peaking in 2005 • Volume trends strong, but box rates lower • Charter rates well off cyclical peaks • Down from $48,500 in Jun 2005 to $31,000 in Jan 2006 (4250 TEU) • Significant capacity additions in 2006-07 • Speculative ships tougher to place • Increased activity in the second hand market • Asset values declining • No open charter exposure until 2013 • Buying assets low and chartering low is consistent with our low risk model • We have significant financial flexibility to take advantage of softer environment Capacity Increasing Dramatically Through 2008 Opportunity for Seaspan Ships Delivered 175 190 199 188 173 277 399 379 255 * Ordered to date Source: Clarkson Research
Taking Advantage of Current Market Conditions Despite Declining Market Conditions Seaspan Able to Effect Accretive Acquisitions • Competitive cost of capital • Diverse global relationships • Long-term charter strategy • Significant financial flexibility Coscon Acquisition – 3500 TEU CSCL Asia Acquisition – 2500 TEU $46.7 mm Purchase Price $41.4mm Purchase Price Source: Clarkson Research
Acquisitions Are Consistent WithSeaspan’s Chartering Low Strategy Containership Time Charter Daily Rates per TEU Source: Clarkson Research.
Long-Term Charters with World Class Customers Coscon Acquisition Demonstrates Seaspan's Commitment to Customer Diversification
Revised Fleet Growth Profile Total Capacity (TEU) Total Ships(1): 10 13 18 25 Additional Investment: – $162.2mm $284.5mm $502.6mm Debt / Book Cap(2): 0.0% 20.2% 46.2% 55.8% 27 29 $89.0mm $89.0mm 52.7% 53.5% • Assumes the 4 newest CSCL vessels are delivered 2 months apart starting in September 2008. • Assumes 60% debt financing of new vessels with additional equity issuance to finance remaining cost.
Seaspan's Business Strategy PositionsUs For Future Vessel Acquisitions • Deep and trusted relationshipswith world class customers • Exceed customer expectations in service-intensive industry • Excellence in ship operations • Partnership approach, not transactional • Long-term charter strategy • Seek to enter into charters greater than ten years • Provide stability of costs to charter liners at below current market rates • Cash flows insulated from cycle • Low charter rates provide significant potential from re-chartering upside Acquisition Criteria • Accretive to distributable cash flow • High quality charterer • Careful assessment of credit and residual risk
Rechartering Upside Outsourcing Trend Seaspan’s Formula Long-Term Charters High Quality Team Sustainable and Growing Dividend Deep Customer Relationships Accretive Vessel Purchases Superior Vessel Operations