Download
1 / 21
210 likes | 369 Views
Effective Connectivity Patterns Associated with P300 Unmask Differences in the Level of Attention/Cognition between Normal and Disabled Subjects. AIIA - L ab , Informatics d e pt . , AUTH, Greece NeuroInformatics.GRoup , AUTH, Greece SINAPSE , National University of Singapore.

E N D
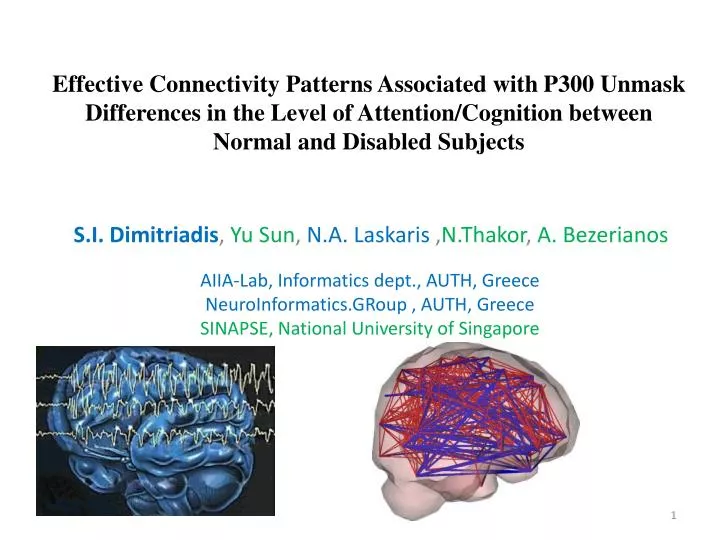
Effective Connectivity Patterns Associated with P300 Unmask Differences in the Level of Attention/Cognition between Normal and Disabled Subjects AIIA-Lab, Informatics dept., AUTH, Greece NeuroInformatics.GRoup , AUTH, Greece SINAPSE, National University of Singapore S.I. Dimitriadis, Yu Sun, N.A. Laskaris ,N.Thakor, A. Bezerianos
Outline • Introduction • P300 is an important event-related potential (ERP) • α-ERDcould be induced by various modalities and cognitive processing • Visual P300 can be evoked through flashing images • Effective Connectivity Patterns (ECPs)related to Visual Stimuli (6) • in both subjects (Normal & Disabled) • Methodology • Brain is a complex network • Effective Connectivity Graphs (ECGs) related to Visual P300 & α-ERD were treated as tensors • Tensor Subspace Analysis & Classification • Network analysis Results Conclusions
P300 is an important event-related potential (ERP) component elicited by infrequent and task-relevant stimulus, and it reflects the processes of attention, stimulus classification, and memory updating(Zaslansky et al., 1996 ; Comercheroaet al., 1999 ; Linden, 2005 ; Polich, 2007) A significant α-band (8–13 Hz in frequency) ERD (α-ERD) could be induced by both sensory stimulation (external event) (Pfurtschelleret al.,1994)and cognitive processing (internal event) in various attention and memory tasks (Basar et al., 2000,2001 ; Klimesch,1997 ) P300was showed to be functionally associated with the cognitive processing reflected by α-ERD (Yordanova et al., 1998 ; 2001)
Recent Findings related to the relationship of P300 & α-ERD As revealed by time-varying effective connectivity, the cortical information was consistently flowed from α-ERD sources to P300 sources in the target condition for all four sensory modalities(Peng et al., 2012)
In order to study the effective connectivity patterns (ECPs) related with P300 in both normal and disabled subjects, we adopted a well-known causality estimator called Partial Directed Coherence (PDC). Our analysis was based on α frequency range (8-13 Ηz) as an attempt to study high cognitive activation and attention in terms of networks at the sensor level. We first attempted to classify correctly the (ECPs) related to visual stimuli of different images for each subject independently (Normal & Disabled) Finally, we explored any topographic difference between normal and disabled subjects in terms of Complex Networks
ΕΕG & CONNECTOMICS FROM MULTICHANNEL RECORDINGS TO CONNECTIVITY GRAPHS FUNCTIONAL/EFFECTIVE MEASURES
EEG & CONNECTOMICS COMPLEXITY IN THE HUMAN BRAIN
Motivation and problem statement • Association of effective connectivity patterns (ECPs) with particular cognitive tasks has been a hot topic in neuroscience • A low number of P300 studies followed a connectivity analysis and especially for decoding ECPs related to different stimuli of the same modality (visual) • We used tensor subspace analysis (TSA) to reduce the initial high-dimensionality of the pairwise coupling in the original effective connectivity network • which • would significantly decrease the computational cost • and • facilitate the differentiation of brain states related to each visual stimulus • The classification scheme treated each ECPs in a trial fashion • We analyzed ECPs by adopting complex network analysis (hubs, small-world index)
ExperimentalProtocol (Visual stimulus) - The images were flashed in random sequences, one image at a time. Each flash of an image lasted for 100 ms and during the following 300 ms none of the images was flashed, i.e. the inter-stimulus-interval was 400 ms. Electrodes = 32 Fs=2048 Hz The disabled subject (Cerebral Palsy) was wheelchair-bound but had varying communication and limb muscle control abilities. In addition, disabled subject was able to perform simple, slow movements with their arms and hands but were un-able to control other extremities. Spoken communication with disabled subject was possible, although he was suffered from mild dysarthria.
ExperimentalSchedule • Each subject completed four recording sessions. • The first two sessions were performed on one day and the last two • sessions on another day. • For all subjects the time between the first and the last session was less than two weeks • Each of the sessions consisted of six runs, one run for each of the six images. • For further details about the protocol followed on this experiment see the original paper related to this dataset (Hoffmann et al.,2012)
Preprocessing Signals were filtered within frequency range of 8 to 13 Hz. Biological artifacts were diminished by means of ICA employing function runica from EEGLAB. Effective Connectivity measure • ARFIT package estimates both the time-invariant parameters of • the MVAR model and its optimum order (Tapioand Arnold, 2001) • The order estimation uses Schwarz’s Bayesian Criterion (SBC) (Schwarz, 1978) • PDCs was computed based on the MVAR model fitted to the signal using an AR algorithm (ARFIT) • Partial Directed Coherence (PDC) is frequency domain characterizations of causality PDC [0, 1] where high values in a certain frequency band reflect a directionally linear influence from channel j to channel i in that band and is normalized by the sum of the influenced processes.
Significant Links • The maximum number of possible directed connections in a network with k nodes is • N =k*(k-1) and for k = 32 , Nmax = 992 . • Thus, the EFG is extremely dense and should be filtered out. • We performed a Statistical filtering analysis: • - A surrogate data method with 200 realizations • Surrogates were obtained by randomize signal to remove all causal relationships between • them(Hesseet al., 2003). • - To correct for multiple testing, the false discovery rate (FDR)method was adopted (Benjamini • and Hochberg, 1995) • Small-World Index • We estimated Small-world index based on directed global (dGE) and local efficiency (dLE). • The calculation of GErandand LErand was based on the procedure described here • which preserves the out-strength but not the in-strength distribution. We repeated this • procedure 250 times. • We then averaged across all random networks to obtain GErand and LErand. The small-world indices γ=LE/LErand and λ= GE/GErandwere then calculated for the FCG under study, • and the ratio S=γ/λ was defined. • This was greater than 1 for small-world networks
Outline of the Tensorial Approach ECG matrix Effective Connectivity TENSOR VECTOR
The linear Dimensionality Reduction Problem in Tensor Space Tensor Subspace Analysis (TSA) is fundamentally based on Locality Preserving Projection • X can be thought as a 2nd order tensor (or 2-tensor) in the tensor space • The generic problem of linear dimensionality reduction in the second order space is the following: • Given a set of tensors (i.e. matrices) • find two transformation matrices U of size and V of that maps these tensors to a set of tensors such that “represents” , where
Optimal Linear Embedding In the case of supervised learning (classification labels are available), the label information can be easily incorporated into the graph as follows: Let and be the transformation matrices. A reasonable transformation respecting the graph structure can be obtained by solving the following objective functions: The objective function incurs a heavy penalty if neighboring points are mapped far apart With D be a diagonal matrix the optimization problem was restricted to the following equations Once is obtained, can be updated by solving the following generalized eigenvector problem Thus, the optimal and can be obtained by iteratively computing the generalized eigenvectors of (4) and (5)
Machine learning validation • The TSA algorithm, followed by a k-nearest-neighbor classifier (with k=6), was tested on trial-based connectivity data from all bands. • The following results have been obtained through a cross-validation scheme that shuffle the trials and get 90% for training and 10% for testing. • The average classification rates derived after applying the above cross-validation scheme 100 times was 100% for both subjects (Dimitriadis et al., 2012)
Effective Connectivity Patterns (ECPs) DISABLED Effective Connectivity Graphs related to P300 for each one of the six target images -The color of the arrow (both body and head) is related with the strength of PDC. Red color (hubs) (outgoing degree = k-1=31). Comparison of ECPs NORMAL • The spatial distribution of hubs for the disabled subject is located mainly in bilateral frontal sites, left fronto-central, in P7 and in CP6. • For the normal subject, two more sensor areas were detected as hubs: PO3 and O1. • Visual inspection of EFGs uncovered greater connectivity strength for disabled subject compared to normal
Small-World Index Small-World index for each flashing image of Fig.1 in both subjects (* denotes significant difference p <0.001 of SW between the two subjects across trials using Wilcoxon rank test; Bonferroni corrected p’ < p/6). EFGs of normal subject are closer to a small-world network compared to the EFGs of the disabled subject for each of the flashing image
Based on our experiments, the tensorial treatment of ECGs succeeded to identical discriminate the six flashing images in normal and disabled subject • Our network analysis revealed important hubs areas consistent in both subjects • located over frontal areas (bilaterally), left fronto-central and at sensors P7 and CP6 • Additionally, in normal subject two more hubs were revealed: PO3 and O1 • By a visual inspection of the topographies based on the connection strength, it is obvious that hubs sensors in disabled subject entrusting the demands of the task related to high cognitive activation and attention • Even though our analysis based on sensor level, the lack of hubs located over left parieto-occipital sites in disabled subject can be related to visional issues related to cerebral palsy that balanced with more effort over frontal and fronto-central areas. • Finally, small-world index uncovered a more well organized network in normal compared to disabled subject
References [1] Dimitriadis, S.I.,Yu, Sun., K, Kwok., et.al.,” A Tensorial Approach to Access Cognitive Workload related to Mental Arithmetic from EEG Functional Connectivity Estimates,” 35th Annual of the IEEE EMBC, Osaka (Japan) 3 – 7 July 2013 [2] Peng, W., Hu, L., Zhang, Z., et al., “Causality in the Association between P300 and Alpha Event-Related Desynchronization,” PLoSONE, vol.7: e34163. doi:10.1371/journal.pone.0034163, 2012 [3] Hoffmann, U., Vesin, J.M., Ebrahimi, T., et. al., “An efficient P300 - based brain-computer interface for disabled subjects,” J Neurosci. Methods, vol.167, pp.115-25, Jan 15, 2008. [4] Sameshima, K., and Baccala, L.A.,”Using partial directed coherence to describe neuronal ensemble interactions,” J. Neurosci. Methods, vol.94,pp.93–103,1999 [5] Ioannides AA, Dimitriadis SI, Saridis G, et. al., “Source Space Analysis of Event-Related Dynamic Reorganization of Brain Networks. Computational and Mathematical Methods in Medicine Special Issue", Graph Theoretical Approaches in Brain Networks", vol. 2012, Article ID 452503, doi:10.1155/2012/452503.
NeuroInformatics.GRoup, AUTH, Greece http://neuroinformatics.gr/ Cognitive Engineering Lab – SINAPSE Laboratory – SINGAPORE http://www.sinapseinstitute.org/projects/cognitiveengr/