Download
1 / 40
400 likes | 564 Views
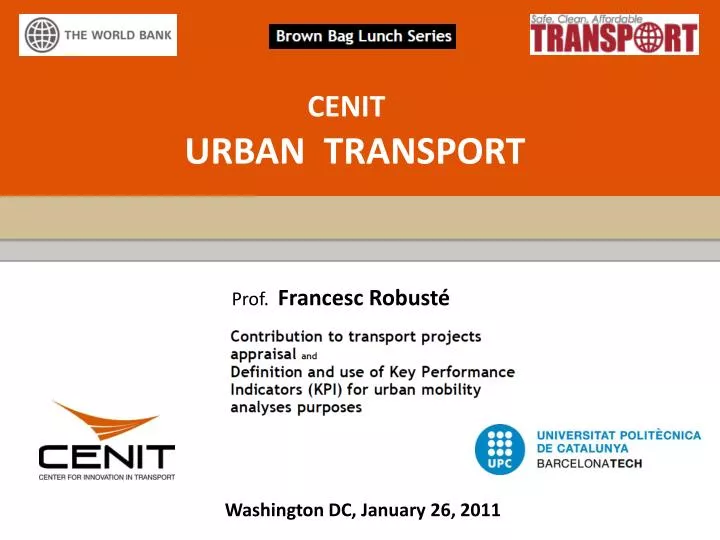
CENIT. URBAN TRANSPORT. Prof. Francesc Robusté. Washington DC, January 26, 2011. PRESENTATION CONTENT. CENIT (Barcelona Tech). KPI’s for urban mobility. Appraisal. Background of CENIT interesting for the WB.

E N D
CENIT URBAN TRANSPORT Prof. Francesc Robusté Washington DC, January 26, 2011
PRESENTATION CONTENT • CENIT (Barcelona Tech) • KPI’s for urban mobility • Appraisal • Background of CENIT interesting for the WB
Aim of CENIT: generation and transmission of knowledge about transportation CENIT presentation • Center for Innovation in Transport (CENIT) created in 2001 (2011: 10 years of innovation) • Consortium Technical University of Catalonia (Barcelona Tech) + regional government • 10% of public finance; 90% or turnover from competitive calls, companies and institutions • Catalan Traffic Service • Barcelona City Council • Metropolitan Transport of Barcelona (bus operator) • Port of Barcelona • Abertis • European Commission (DGTREN) • Spanish DoT • CEDEX • Spanish Ministry of Education & Science • Government of Catalonia
CENIT RDi in Transport: system, service, scientific perspective CENIT presentation Administration CSc & technicians BSc 43% Civil Engineers Engineers • Multidisciplinary and young team of 40 people • Scientific/ quantitative approach • Professional experience in implementations • Social, energy and environmental awareness Francesc Robusté Director of Transportation Dept. Jaume Barceló Director of Mobility and ICT Dept. MateuTurró Director of Transport Financing Dept. • CENIT leads transport research in Spain and cooperates with international experts 83 % of staff are BSc and engineers 18% of staff are PhD and teach at Barcelona Tech 36% women
CENIT presentation Internationally renowned scientific research and dissemination • Papers published in prestigious journals: • Transport Research parts A, B, C, D, E • Transportmetrica • Transportation Science • IEEE • Transportation Research Record • Continuous training and improvements with exchanges and post-doc stays and sabbaticals: • Universityof California Berkeley • Massachusetts Institute of Technology • Rensselaer PolytechnicInstitute • Leeds University • Researchdissemination at both Spanish and international level: • Transportation Research Board Congress • Pan-American Congress • World Congress on Transport Research • International Symposium on Transportation and Traffic Theory • Spanish Transport Engineering Congress
CENIT presentation CENIT joins important initiatives and innovation projects in urban mobility at international level • Implementation of cutting-edge research in Barcelona with the Volvo’s Centre of Excellence for Future of Urban Transport(UC Berkeley): • RetBus • Macroscopic Fundamental Diagram for traffic • International agreements between CENIT and other transport research centers: • ITS center Tokyo • Urban Transport Systems Laboratory, EPFL, Lausanne • Rensselaer Polytechnic Institute • LET, Lyon • Universidad PontificiaBolivariana, Bucaramanga • CENIT is member of the European Conference of Transports Research Institutes (ECTRI)
Urban mobility is complex Urban mobility is a key factor for the competitiveness of metropolitan regions • XXIst century will likely be characterized by urban mobility • +50% of the world population lives in urban areas • Congestion problems: costs, accidents and climate change • Urban mobility has significant relation to GNP of a region • ICT bring emphasis in the operations and • management: Intelligent Cities Tactical Strategic Industrial ICT Civil Systems’ approach for complexity: operations, economics, demand behavior, appraisal, regulation, sustainability, finance… Operational
Eco-mobility Transit PV Rail bicycle car pedes-trian motor-cycle bus BRT taxi shared / public metro commuter rail LRT HOV “BiCiNg” carsharing CENIT expertise Urban mobility modes: are they a partition ? • Cars - traffic (congestion) • Public Transport: bus, BRT, LRT, metro • Taxis • Freight distributions • Bicycles • Pedestrians • Urban mobi-litymodes CENIT expertise
KPI’s for Urban Mobility Conjoint / coupled layout, operations and pricing (1) Cities are generic Urban mobility is generic (systems approach) Accessibility Yokohama Network Flow SFO City Structure how we use space Mobility how we move thru space Nairobi Functional parameters to describe mobility Network Vehicle Density
$/q(PC) $/q(PT) AC PT AC PC q(PT) q(PC) KPI’s for Urban Mobility Conjoint / coupled layout, operations and pricing (2) Street space According to vehicle footprint, street space, demand and unit social costs, efficient mobility supply can be provided Car 1 Transit Demand Any investment improving the car network, gives higher generalized costs (equilibrium) for all the users (Mogridge’s Paradox) Mix 1
KPI’s for taxi Distribution of taxicab demand, revenues and supply according to hours CSI = 5.9
KPI’s for taxi KPIs for evaluating Barcelona TAXI’s performance • Accuracy of KPIs depends on the statistical significance of the taxi sample (37 out of 10,000) • KPIs depend on many factors:time of day, taxi performance, zone, day of week, month… • KPIs have been calculated for every hour of week
KPI’s for taxi KPIs for evaluating Barcelona TAXI’s performance • Key Performance Indicators : • Gross income per hour • Services per hour • Distance in service • Distance “empty” • Time vacant • Time between services • Average service fare • Average service distance • Average service duration • Average speed • Annual kilometres • Annual gross income
KPI’s for taxi “Reasonable business” profitability • How muchshould a taxi driverearn? • Ourmethodologycalculates: • Costs: • AnnualIncome • Profitability: • Return On Equityadapted to taxi owners. • The asset is the taxi license. • Diesel comsumption • Mainteinance costs • Parking • Amortization • ... • + • Salary • The number of km per hour and year is themainindicator to calculate costs • A basic salary is included in thedefinition of costs • The “ReasonableProfitability” is a orientativevaluegivenbythe Central Spanish Bank for Small and Medium Enterprises (SME) • 2009 results: • Annualaverageincomme: 42,379 € • Annualaverage costs (withsalary): 36,175 € • Benefits: 6,204 € • Desiredbenefits to reach a “ReasonableProfitability”: 6,484 € Basic informationtomanageSupply-Fareissues
GSI: Global Service Indicator Indicators Attributes KPI’s for transit KPIs for PUBLIC TRANSPORT in Barcelona Metropolitan Area TAI: Territorial Accessibility Indicator Bus-stops density SAI: Service Accessibility Indicator Frequency IQI: Internal Quality Indicator Comfort RQI: Route Quality Indicator Speed
KPI’s for transit KPIs for PUBLIC TRANSPORT in Barcelona Metropolitan Area RQIm= 11,7 km/h CV=0,10 TAIm=22,7 bus-stops/km2 C=0,61
KPI’s for traffic - congestion Objective and perceived KPIs for traffic congestion characterization Indicator of intensity of demandimpact(IOID) Objetive indicator of networkeffects(IOAR) Objetive Congestionindicator(IOC) OBJETIVE INDICATORS Indicator of demandeffects(IOAD) Indicator of temporal effects(IOAT) Indicator of topology
KPI’s for traffic - congestion Objective and perceived KPIs for traffic congestion characterization SURVEYS Subjectiveindicator of demandeffect(ISAD) Subjectiveindicator of networkeffects(ISAR) Subjectiveindicator of temporal effects (ISAT) SUBJECTIVE INDICATORS • Subjectiveindicator of intensity of impactdemand(ISID)
KPI’s for freight distribution Implemented policies for improving urban freight distribution
KPI’s for freight distribution Urban freight distribution operations and use of L/U parking
KPI’s for freight distribution Loading and unloading parking space deficit in Barcelona
Future of Urban Transport European Parliament, 2010 (under publication) Most of the innovation in urban mobility will come from the re-engineering of old concepts with the help of ICT: success or failure of implementation will depend on a package of ‘soft’ management measures that involve understanding stakeholder behavior and managing the system in an integrated, efficient and dynamic (real-time) way, rather than on ‘hard’ physical infrastructure or new vehicles. New energy sources for vehicles are tactical changes; however, the physical or functional aspects of overcoming a certain distance at a certain speed will remain.
Towards a KPI of Urban Mobility (1) Objective: give a city a “grade” about mobility and follow it • Attributes (some measured): • Unit social cost of overcoming a distance ($/pax-km) • Mobility behavior patterns • Land use patterns and city planning issues • Space distribution • Time distribution • Modal split • Safety • Reliability • Sustainability • (Energy) • (Emissions) • (ICT technology) • Social equity: income, gender, MRP (universal accessibility) • Perception (weights from local surveys) Policy objectives? Measure attributes Decide some weights Aggregate Mobility Indicator (similar to CSI in transit)
Towards a KPI of Urban Mobility (2) Objective: give a city a “grade” about mobility and follow it CSI in transit
KPI for a corridor What is the “optimal” transport mode for a given corridor?
Appraisal Appraisal (CBA + MCA integration): our approach • Socio-economic appraisal of transport projects: • Dealing with an investment proposal • Political input and/or decisions • Many stakeholdersand interests “In front of huge problems, let’s bring small solutions” • In front of a complex system with many stakeholders and cross-perspectives, we claim for: • Simple and transparent appraisal methods • We should underline the process more than the algorithm or a particular outcome • Avoid black boxesor apparently sophisticated methods with leaks
F2 ECONOMISTS POLITICIANS PLANNERS ENGINEERS PARTIAL EVALUATION E’ij F1 Appraisal Many options that are complementary Multicriteria Anal. Financial analysis • Hierarchy (AHP, nested logit) • Goal programming Riskanalysis • Multi-objective programming • Group DSS Sensitivity analysis ELEMENTS Weights (Delphi) CBA • Costs • Benefits CRITERIA (m) Partial evaluation ALTERNATIVES(n) • Qualitative • Over-classification (Electre) • Utility: U:Em[0,1]
Appraisal Contribution to transport projects appraisal • Mix: benchmarking • Effect-stakeholders matrix, applicable to several typologies of transport projects(highways, ports, airports, railways, freight centers and urban projects) to appraise their distributional effects • Visualization of all the effects: transfers, winners, losers... • Active cells • Cell zooming • Relevant cells • Tool for efficient and transparent decision making
Appraisal Incidence matrix (effects-stakeholders) INCIDENCE MATRIX
Appraisal Appraisal process – Methodology flowchart • Effects vs. stakeholders • Incidence matrix (SE) • Active cells • Cell expansion • Transfers: cancel out in each row • Relevant cells Cell coloring • Segment of preference (f + se) • NPV by rows and columns • Sensitivity and risk analysis
Appraisal Incidence matrix – Active cells
Appraisal Incidence matrix – Cell expansion
Appraisal Incidence matrix - NPV by rows and columns • Distributional effects:
Appraisal Strengths and transportability • Applicable to all transport projects typologies: (even to non-transport related projects) Railway projects • Improvement of an existing line • Line reopening • Line restoration • Line closure • Traffic jams elimination • New HSL • Line electrification • Investments in interoperability • Cross-level elimination • Improvement of rail terminals • Line extension • Connections to ports, airports and terminals • Road pricing, new bus services, capacity expansion, safety... Highway projects META, GESTA Port projects • Port enlargement, concession, … Airport projects • Construction/expansion of terminal, baggage handling… Urban projects • Construction/expansion of terminal, baggage handling… • Comprehension of distributional effects: Impacts and benefits for the different users & society
A DSS for financial screening Appraisal DSS for financial acceptability screening • Application to tramway and metro projects financed by EIB: • Analysis of financed projects • Continent / areas • Country • Mode • Project types • Detect outliers
A1 A2 w3 A3 w2 w1 Graphical tools in MCA (1) w3 w3 A1 A4 A2 A5 A3 A6 A7 A8 w1 + w2 + w3 =1 w2 w2 w1 w1 36
k ejk Área(Aj) 1 1 Carreteras 200 150 FC alta velocidad Autopistas 100 50 0 Aeropuerto mercancías FC convencional Aeropuerto pasajeros Graphical tools in MCA (2) GHP (from AHP) 37
Background of CENIT perhaps interesting for the WB URBAN MOB ILITY
Background of CENIT perhaps interesting for the WB ECONOMIC IMPACT OF AIRPORTS AIRPORT SYSTEM CAPACITY AIRPORT ACCESS APPRAISAL LOGISTICS : Physical Distribution, SCM, eLogistics, Logistic platforms, Logistic Activity Zones LAZ in ports, many-to-many distribution optimization Guidelines for logistics centers and LAZ in ports LAZ, LC & training in Mediterra-nean (EIB)
Thank you for your attention! Prof. Francesc Robusté f.robuste@upc.edu Dr. Sergi Saurí sergi.sauri@upc.edu Dr. Marta Sánchez-Borràs marta.sanchez-borras@upc.edu