Download
1 / 15
150 likes | 253 Views
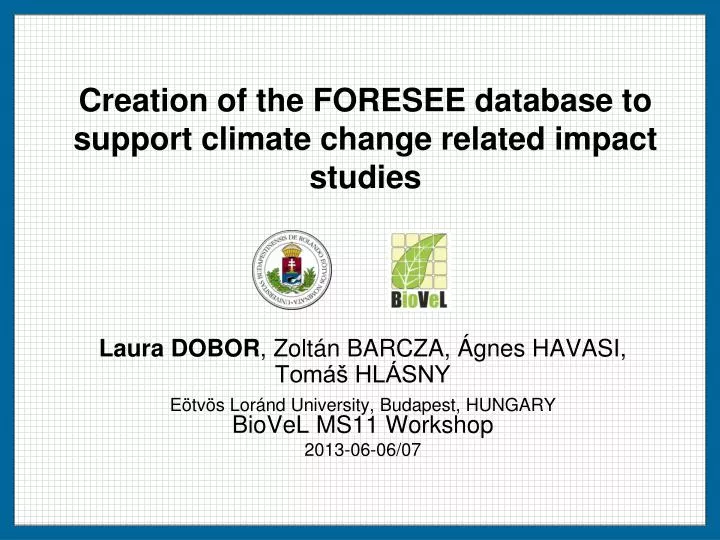
Creation of the FORESEE database to support climate change related impact studies. Laura DOBOR , Zoltán BARCZA, Ágnes HAVASI, Tomáš HLÁSNY Eötvös Loránd University, Budapest, HUNGARY BioVeL MS11 Workshop 2013-06-06/07. Outline. Motivation FORESEE database Construction

E N D
Creation of the FORESEE database to support climate change related impact studies Laura DOBOR, Zoltán BARCZA, Ágnes HAVASI, Tomáš HLÁSNY Eötvös Loránd University, Budapest, HUNGARYBioVeL MS11 Workshop 2013-06-06/07
Outline • Motivation • FORESEE database • Construction • Data selection for the past/future • Bias correction • Structure of the created database • Availability
Motivation • QUESTION: What is the expected effect of climate changeon plant productivity and carbon balance of croplands in Hungary? • MAIN AIM: perform impact study using process based biogeochemical model + crop model • FIRST STEP: Need for daily meteorological data for the past and also for the future. • We did not find good database, so we decided to create one!
FORESEE database Daily meteorological database Maximum/minimum temperature, precipitation 1. 1951-2009: Observation based data 2. 2010-2100: Bias corrected climate model data based on 10 different regional climate models (RCMs). 1/6 x 1/6 DEGREEREGULAR GRID
Construction - Data selection - Collect reliable data in daily time steps for grid points • Modification: Monthly correction with CRU TS 1.2 database (monthly) fit the monthly averages (tmax,tmin) and totals (pr) PAST 1951 1961 2009 E-OBS database(daily) 1951 2010 2100 FUTURE: 10 regional climate model (A1B scenario) ENSEMBLES project(daily) • Modification: Bias correction based on the modified E-OBS
Lower horizontal resolution (~ 150 km) Whole Earth Higher resolution (~ 25 km) Limited area Detailed topography and physical parameterizations Construction- List of the models -
+2000 mm -2000 mm -700 mm +700 mm Example to demonstrate the problem of inherent systematic errors 1961-1990 precipitation - REMO-ECHAM5 The model underestimates the annual preicipitation The model overestimatesthe annual preicipitation Original climate model after interpolation minus CRU corrected E-OBS [~observation]
Construction – Bias correction I • Every climate model output contains systematic errors • If we would like to use them directly [as realistic weather], we have to execute a bias correction on them • Assumption: the systematic errors are stable in the time • Determine the errors based on the past (observation and model comparison) • Correct the models using correction factors (same for the past and the future)
Construction – Bias correction II • Based on monthly cumulative distribution function (CDF) fitting technique (Reference period: 1951-2009) Precipitation: amount and frequency (2 steps) • Create or delete wet days • Fit the observed and the simulated precipitation time series distribution function Observation based data Climate modelresult When the model simulates too much wet days 70% dry days 50% dry days
Precipitation amount correction • Determinequanitlefunctions(1000 portions) • Modelsimulation • Observation • Toeveryquantilesbelongone-oneprecipitationamount • Ratios of theseamountsgivethecorrectionarray (1000 elements) • Correctionsteps: • Inwhichquanitle is ordered the givenprecipitationamount? • What is thecorrectionfactoratthat quantile? • Scalewiththatcorrectionfactor! Daily precipitation amout [mm/day] Observed data Daily precipitation amout [mm/day] Observed data Daily precipitation amout [mm/day] Corrected climate model data Daily precipitation amout [mm/day] Raw climate model data
Precipitation frequency correction:is it important?yes! - an example - ― CRU corrected E-OBS (obs) Solid lines: non-corrected, raw climate model results Dotted lines: bias corrected climate model results • Spatial averages for the whole target area • Wet day: prec. amount >=0.1 mm
Model selection for impact studies: How can we visualize 10 different model in one plot? THERMOPLUVIOGRAM FOR CENTRAL EUROPE • yhf
Availability - Webpage - • 33 NetCDF (Network Common Data Form) files, size: about 22 GB • Open access: http://nimbus.elte.hu/FORESEE • More information, news/updates, publications • Current version of database: FORESEE v1.1 • It is possible to create a workflow for the data retreival
Summary • We created an open access daily database for the 1951-2100 period (FORESEE),which contains • Observation based datasets for the past • 10 bias corrected climate model results for the future • The goal was to create the meteorological background (precipitation,maximum/minimum temperature) • for climate change-related impact studies • for other modeling purposes