Download
1 / 33
330 likes | 338 Views
This dataset includes borehole radial tilt records, changes in GPS line lengths, continuous gravity data, seismic amplitudes, earthquake locations, infrared and visible images, and gas monitoring data related to volcanic activity at Summit Caldera and Pu’u ’Ō’ō since January 1, 2010.

E N D
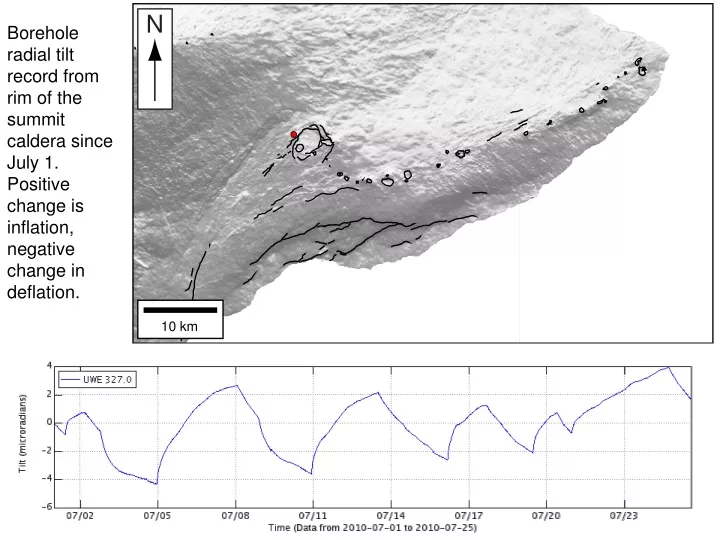
Borehole radial tilt record from rim of the summit caldera since July 1. Positive change is inflation, negative change in deflation.
Change in line length between GPS stations spanning the summit caldera since January 1. Positive change is inflation, negative is deflation.
Borehole radial tilt record from the north flank of Pu’u ’Ō’ō since July 1. Positive change is inflation, negative change in deflation.
Change in line length between GPS stations spanning the rim of Pu’u ’Ō’ō Crater since January 1. Positive change is inflation, negative is deflation.
Change in line length between GPS stations spanning the flanks of Pu’u ’Ō’ō. Positive change is inflation, negative is deflation.
Change in line length between GPS stations spanning the east rift zone. Positive change is extension, negative change is contraction.
Continuous gravity data from caldera floor on July 24 with Webcam images from summit vent. 23:30 7/24/10 22:30 7/24/10
Average seismic amplitude at a station on the caldera rim since July 1.
Average seismic amplitude at a station on the caldera rim since July 22.
Average seismic amplitude at a station just west of Pu’u ’Ō’ō since July 1.
Average seismic amplitude at a station just west of Pu’u ’Ō’ō since July 22.
Earthquake locations for events occurring between 1/1/10 and 7/25/10.
Earthquake locations for events occurring between 7/1/10 and 7/25/10.
July 14, 2010 – Infrared and visible composite of coastal plain
July 23, 2010 - Infrared and visible composite of coastal plain
July 23, 2010 – infrared images of the summit vent at two different times.
Area on the north rim of Pu’u ’Ō’ō that collapsed on Tuesday, May 11, 2010
June 11, 2010 – aerial visible (top) and infrared (bottom) images of Pu’u ’Ō’ō crater
Pu’u ’Ō’ō Webcam “glow” image from night of 7/24 to 7/25, 2010 Pu’u ’Ō’ō Webcam “glow” image from night of 7/23 to 7/24, 2010 Glow images are composites of all images that were acquired overnight and show any incandescence that occurred over that time period.
Wind direction at a gas-monitoring station on the south rim of Halema’uma’u Crater since July 22.
SO2 concentrations at a gas-monitoring station on the south rim of Halema’uma’u Crater since July 22.
490-720 t/d SO2 SO2 = yellow CO2 = red
SO2 = yellow CO2 = red
430 -870 t/d SO2 SO2 = yellow