Download
1 / 12
120 likes | 266 Views
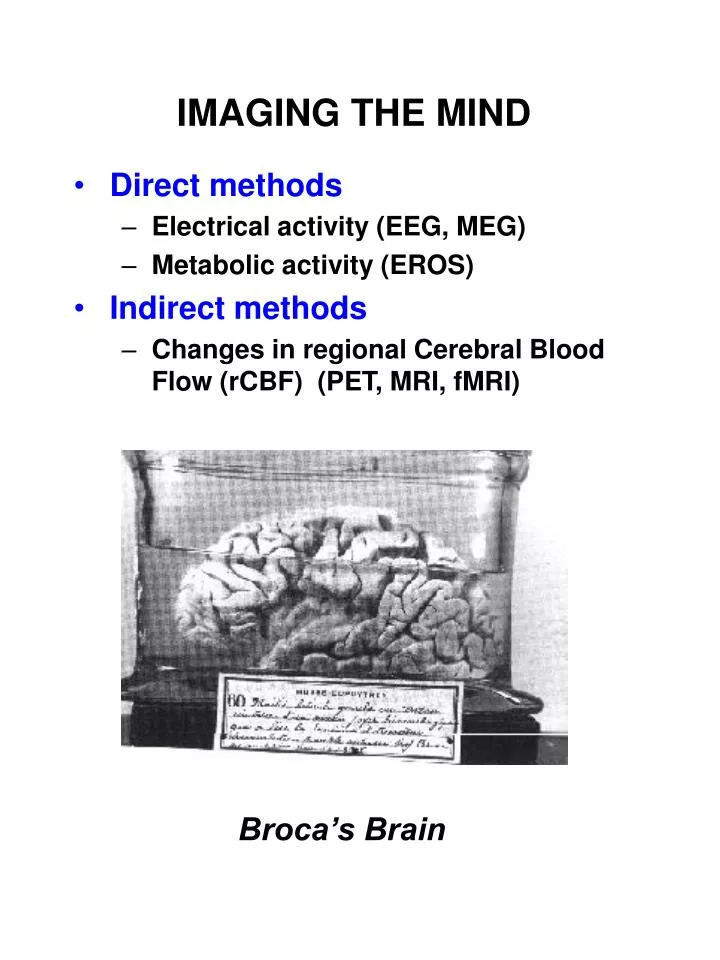
IMAGING THE MIND. Direct methods Electrical activity (EEG, MEG) Metabolic activity (EROS) Indirect methods Changes in regional Cerebral Blood Flow (rCBF) (PET, MRI, fMRI). Broca’s Brain. EEG and EVENT-RELATED POTENTIALS (ERPs).

E N D
IMAGING THE MIND • Direct methods • Electrical activity (EEG, MEG) • Metabolic activity (EROS) • Indirect methods • Changes in regional Cerebral Blood Flow (rCBF) (PET, MRI, fMRI) Broca’s Brain
EEG and EVENT-RELATED POTENTIALS (ERPs) • Postsynaptic extracellular potentials vary with neuronal activity • Masses of pyramidal cells generate a varying electrical signal, the EEG • Changes in the EEG that are related to psychological events (ERPs) can be seen by averaging • Various ERP “components” are sensitive to memory processes
MAGNETOENCEPHALOGRAPHY • methodology • Incredibly weak magnetic signal (femtoTeslas) • Detected by SQUID ($3M, 16,000 lbs, minus 269 deg C • Works for neural fields tangental to surface
EVENT-RELATED OPTICAL SIGNALING (EROS) • Infrared light source placed on scalp • Scattered light picked up by optic detector • Signal varies with metabolic state of neurons
PET IMAGING(Positron Emission Tomography) • Subject ingests radioactive tracer • Does cognitive task for several minutes • Metabolic activity increases regional cerebral blood flow and glucose metabolism in specific areas • Tracer is deposited more in these areas than others • Isotopes decay and emit positrons • These are detected and an image of activity reconstructed
MAGENTIC RESONANCE IMAGING (MRI) • Align the spins of Water-based hydrogen atoms by powerful magnetic field • Create a “gradient” in the field • “pulse” the field witha strong radio-frequency signal thatperturbs the alignment • Using an RF detector, track the return to alignment • With really complex computing, reconstruct the 3D density of tissue in the brain
MRI vs. fMRI fMRI studies brain function MRI studies brain anatomy Thanks to Jody Culham, fMRI for Dummies http://defiant.ssc.uwo.ca/Jody_web/fmri4dummies.htm
FUNCTIONAL MAGNETIC RESONANCE IMAGING(fMRI) • Oxygenated blood has different magnetic properties than deoxy • So comparing MRI between target task and “control” task (a challenge) reveals areas of task-related activation
D’Espesito & Ranganath (2000) • In scan 1, a subject is asked to remember a face. Areas at the rear of the brain that process visual information are active during this task, as is an area in the frontal lobe.In scan 2, the subject is asked to "think about this face." Surprisingly, the hippocampus is activated - the first time this has been documented. The hippocampus was already known to be important for memory, but these results show that this part of the brain is specifically active during the time when we are remembering new information. • In scans 3 and 4, the subject was asked to compare another face to the remembered face. Some of the same visual areas are activated as during the initial memory task, but other areas, such as part of the frontal lobe, are involved in making a decision about the memory. • Credit: Mark D'Esposito and Charan Ranganath Department of Psychology & Helen Wills Neuroscience Institute University of California, Berkeley (2000)
fMRI (cont’d) • Event-related fMRI allows tracking of the “hemodynamic response” to individual events: Source: Kwong et al., 1992
Method TempResol SpatialResol Depth TechDiffic Cost EEG Poor Mod Mod Mod Mod ERP Excel Mod Mod Mod Mod PET Poor Mod Good High High BlockedfMRI Poor Excel Excel High High Event-Rel fMRI Good Excel Excel High High MEG Excel Good if Tang Mod High High EROS Excel Excel Mod Mod Low CHOOSING AN IMAGING METHOD • There is no single ideal method • Advantages and disadvantages to each