Download
1 / 41
440 likes | 642 Views
Office of Project Management Metrics Report Presentation. Phil Braun Project Management Consultant – Alliant Energy – Office of Project Management. Triangle Outer Cost/Date. Contingency. Triangle Inner Cost/Date. Framework. Metric Report is run at least monthly (some are every two weeks)

E N D
Office of Project ManagementMetrics Report Presentation Phil Braun Project Management Consultant – Alliant Energy – Office of Project Management
Triangle Outer Cost/Date Contingency Triangle Inner Cost/Date Framework • Metric Report is run at least monthly (some are every two weeks) • Every project is assigned two dates and two dollar amounts • Triangle Inner – Finish date (based on Project Schedule) and dollar amount are updated every two weeks • Triangle Outer (Goals) – Finish date and dollar amount to include contingency (Determined in Project Charter and Project Change Requests) • Comparing the current TI to the TO every reporting period = Remaining Contingency
Metrics (continued) • When completed, the final report will contain the following worksheets in an Excel Workbook for each project governed by OPM: • Accomplishments • Dashboard • Vendor Scorecard • Change Management Dashboard • Metrics Report • Task Graphs • Project Performance Graphs • Resource Allocation • Resource Non-Working Time • Triangle & Benefit Summary • Risk Matrix • Issues Matrix • Communications Matrix • Training Matrix • Decisions (Updates at least monthly)
Accomplishments Following questions are answered by the Project Manager in the Accomplishments page in the project metrics report: • Review Date • Project Driver (Time, Cost, Scope) • Overall Project Health (Completed by OPM using Project Dashboard) • Executive Summary • Key Decisions, Issues, and/or Risks • Significant Accomplishments Since Last Meeting • Major Work Planned Over Next Period • Comments • Follow up Items from previous meeting • Outcome of Action Items from Previous Meeting
Project Dashboard Used to communicate status of the project. Information taken from latest metric report and put into Microsoft Excel Dashboard is then made into .pdf file and placed on Company Intranet Data entered into input area that drives formulas to calculate variances and determine overall status color All Projects are rolled up to Portfolio Dashboard 5
Project Dashboard (continued) Input area 6
Project Dashboard (continued) Calculated Fields Time and Cost Contingency Color indicator based on matrix 7
Project Dashboard (continued) Calculated Fields Average Task Completion Rate: • Resource Over allocation • PMPA Score 8
Project Dashboard (continued) Overall score calculation Every new project starts with a total of five (5) points. The resulting score determines the overall project health indicator as follows: GREEN equal to or greater than 3.5 and up to 5 points; YELLOWequal to or greater than 2 and up to 3.4 points; RED equal to 0 and up to 1.9 points If a project is projecting over budget or late,then its Overall Health will be indicated as “RED.” 9
Vendor Scorecard • Vendor Scorecard is completed by the Project Manager to track Vendor performance on a project. The following data is tracked: • Overall Vendor Performance • Project Name • Vendor Name (one report done for each vendor if multiple vendors on project) • Type of Contract • Contract Dollar Amount • Purpose for Vendor • Has this Vendor been used on a previous contract? • Current Risk Score for Vendor portion of Risk Matrix and Risk Level for Vendor • Questions on Vendor Performance • Each section contains a comment area that can be used if needed
Vendor Scorecard Questions • Resource (Red, Yellow, Green, N/A – Answers) • Is the vendor providing enough resources to get the work done? • Are the vendor resources knowledgeable about the product? • Is the vendor responsive to questions and requests? • Is the vendor Project Manager performing effectively? • Performance (Yes, No, or N/A – Answers) • Are deliverables being completed on time? • Is the cost still in-line with the current contract? • Is the vendor providing tasks that are essential for project success and are they updating those tasks on timely basis? • Is the vendor meeting quality expectations? • Issues (Taken from Issues Log – Automatically calculates Red, Yellow or Green) • Customer Satisfaction (Yes, No, or N/A – Answers) • Meets commitments made to Stakeholders? • Is the Project Manager satisfied with the vendor? • Is the Project Team satisfied with the vendor? • Escalation (Yes, No – Answers) • Have you had to escalate any issues to the vendor’s management? • If yes, were the issues resolved as expected? • Vendor Milestones (Green or Red based on if Milestone is completed on time) • Updated from metrics report
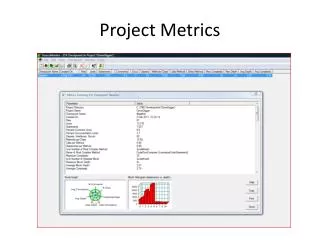
Metrics Report The metrics report is ran by using a macro that exports a Microsoft Project schedule to a Crystal Reporting engine that then exports the following information to Microsoft Excel. Metrics completed in categories: • Project Plan Summary • Date Summary/Task Summary • Tracking Milestones • Cost Summary/% Completion Rate • Miscellaneous • Comments • Audit Summary • Metrics Summary • Project Plan Audit • Project Plan Metrics
Metrics Report (continued) Project Plan Summary
Metrics Report (continued) Date/Task Summary
Metrics Report (continued) Tracking Milestones • List of Milestones set by Project Manager • Fields Tracked include the following: • Task Name • Triangle Inner Date • Triangle Outer Date • % Complete • Difference in weeks
Metrics Report (continued) Cost Summary/% Completion Rate
Metrics Report (continued) Miscellaneous • # Scope Change Requests • Approved changes to scope on the project • PMPA Score • Internal score used to gauge strength of schedule • CSAT (Customer Satisfaction) Score • Currently in progress to determine best way to capture metric
Metrics Report (continued) Comments • Used to comment on changes that may need to be made to schedule • Used to relay information regarding schedule and metrics report
Metrics Report (continued) Audit Summary
Metrics Report (continued) Metrics Summary
Metrics Report (continued) Project Plan Audit • Displays activities that are on the Critical Path Project Plan Metrics • Displays following activities: • Tasks scheduled for completion by the current status date • Tasks scheduled for completion by the current status date and actually completed • Tasks scheduled for completion by the current status date that were deleted • Late tasks • Total tasks deleted • Total tasks added • Grand total of tasks completed since last status date • Tasks scheduled to be completed during next period
Task Completion History Graphs • Task Completion History Graphs • Shows the Task completion rate by reporting period
Forecasted Project Completion Date • Calculates Approximate finish date based on tasks being completed every reporting period • Uses trend lines for analysis
Time & Cost Contingency • Contingency is the difference between the Triangle Inner Date/Cost and Triangle Outer Date/Cost • Graph shows contingency history by reporting period
Time vs. Work • Graph is created in Microsoft Project using Analyze Timescaled Data in Excel… Add in. • Graphs work to be completed over the length of the project.
Shows Percent of Allocation by Week Resource Allocation Capacity (Includes Vacation and Holidays) Resource Name Shows all projects that resource is assigned to Data is taken from Project Server 2007 – Resource Center and downloaded to Microsoft Excel. Macro is then ran to format data and add color, format, etc.
Resource Non-Working Time • Resource Enters Non-Working time into Microsoft Outlook Add-In • Time is placed in MS Outlook calendar and also placed into MS Project Server • Resource Calendar impacts project schedule • Report allows PM to see scheduled time off for team
Triangle and Benefit Summary Triangle Outer and Triangle Inner information • Cost broken out by year and summed • Scope – Must have and nice to have • Explanation of benefits
Matrix Types Risk Matrix • Updated weekly • Projects categorized as High, Medium or Low risk • Following categories are used: • Technical, Quality & Performance • Project Management • Organizational • Vendor • Other External Header of Risk Matrix
Matrix Types (continued) Header of Issue Matrix Issues Matrix • Used to track issues on the project Communications Matrix • Used to track needed communications relevant to project Header of Communications Matrix
Matrix Types (continued) Decision Matrix • Used to track decisions made by project team or decisions that affect the project Header of Decision Matrix Training Matrix • Used to track training needs for the project • Each project can develop and maintain their own training plan
Portfolio Dashboard Legend
Examples • Examples of metrics reports are available as a hard copy here today • If you are interested in receiving a soft copy please email philipbraun@alliantenergy.com