Download
1 / 33
330 likes | 453 Views
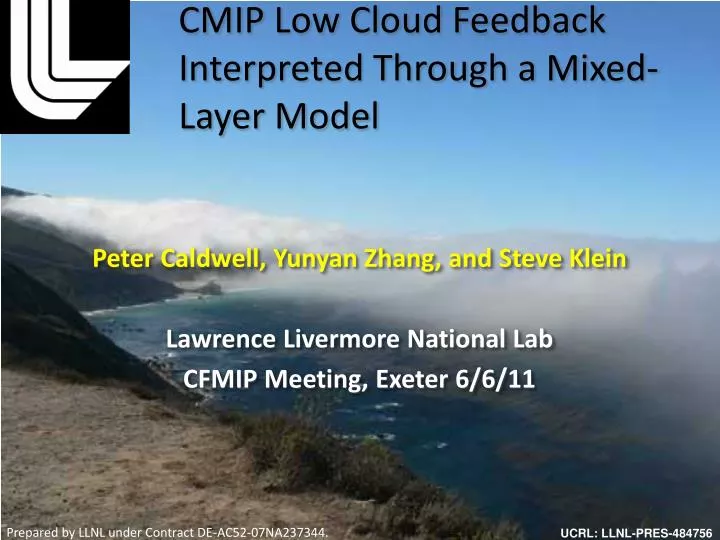
CMIP Low Cloud Feedback Interpreted T hrough a Mixed-Layer Model. Peter Caldwell, Yunyan Zhang, and Steve Klein Lawrence Livermore National Lab CFMIP Meeting, Exeter 6 / 6 /11. UCRL: LLNL-PRES -484756. Motivation:. GCM disagreement is largest for low clouds

E N D
CMIP Low Cloud Feedback Interpreted Through a Mixed-Layer Model Peter Caldwell, Yunyan Zhang, and Steve Klein Lawrence Livermore National Lab CFMIP Meeting, Exeter 6/6/11 Prepared by LLNL under Contract DE-AC52-07NA237344. UCRL: LLNL-PRES-484756
Motivation: • GCM disagreement is largest for low clouds • because low clouds depend sensitively on small-scale processes which are hard to parameterize • Problems due to cloud physics, not dynamics (?) • dynamics better resolved than cloud physics • Cloud changes are dominated by thermodynamic rather than dynamic changes (e.g. Bony et al, ClimDyn 2004) Hypothesis: a limited area model forced by output from various GCMs will produce more consistent, physically-defensible low-cloud changes.
Approach: Mixed Layer Model (MLM) Cloud fraction, LWP, etc CMIP model output (or reanalysis) • mixed-layer model Entrainment parameterized following Lewellen2 (JAS 1998) w/ wind-shear term (JClim 2009) Turbulence keep qt and sl well-mixed in boundary layer 1. Get daily SST, surface pressure, winds, free-tropospheric T, q, and subsidence, advection of BL T and q from GCM output qt=qv+ql sl=cpT+gz-Lql 3. Calculate cloud fraction as % of time cloudy MLM solution is found (Zhang et al, JClim 2009) 2. Run MLM to equilibrium using GCM model forcing for each day zi Strong LW cooling at cloud top destabilizes BL Entrainment warms, dries BL • MLM is simple and easy to interpret • Existent local model studies do not assess forcing uncertainty or variability • exception=Lauer et al (JClim2010) regional model forced by 3 GCMs Benefits: Ocean
Model Validation: When forced by ERA40 for 1990-2001, this approach reproduces the observed geographical distribution of cloud and the observed low-cloud vs. LTS relationship (Obs) Sept-Nov low cloud observed from ISCCP and from the model. Red boxes denote the 6 Sc regions identified in Klein + Hartmann (JClim 1993) and used below. • Results decent, but equatorial and near-coast values are overpredicted • Not equilibrated due to sharp upstream gradients • The observed LTS vscldfrac relation is nicely reproduced • Comparing ISCCP obs and ERA-Interim-forced MLM cldfrac for 2006, approach has poor daily skill (r2≈0.2), decent weekly skill (r2≈0.5), and good seasonal skill (r2≈0.8) LTS (K) Modeled and observed relation between LTS and cloud fraction using each season for each region as a data point.
Forcings from GCMs ERA-Interim RH for DJF 2006 with Predicted Inversion Top RH (%) Compiling MLM forcings from GCM data is generally easy but: Free-tropospheric boundary conditions require inversion height estimation since BL depth changes with time (see graphic) ∇SST and ∇qs(SST) are good predictors of T and qgradients; BL depth advection is not computable, v∇zi=0.49mm/day is assumed Subsidence is computed assuming constant divergence (using 10m winds)
Forcing Changes DoGCMs produce expected/consistent forcing changes? • Divergence decreases but change < daily noise • T, q, EIS, and dθ/dz changes large & positive • Advection increases, particularly for q • BL ht robustly increases Climate Change/typical daily noise Totalcldfrac, only using monthly variability Inter-modelaverage change in MLM forcings between 20th century (1981-2000) and A1B (2081-2100) runs normalized by the standard deviation of current-climate data (with annual cycle removed).
Forcing Changes Is inter-model forcing variability *actually* less thancldfrac variability? • GCMs differences in cldfrac changes > in all other variables except EIS even when daily variability is omitted ⇒Inter-model spread in GCM-predicted cloud is generally bigger than spread in forcings Inter-model variability in Clim Change typical climate change noise Totalcldfrac, only using monthly variability Standard deviation across models of variable change for 2080-2100 – 1980-2000 normalized by the inter-model average standard deviation of current-climate data (with annual cycle removed).
Results: Current-Climate Does the MLM improve current-climate prediction? • MLM under-predicts, GCM overpredicts • MLM improves seasonal and regional pattern • Conclusions independent of whether GCM total cldfrac or random-overlap of monthly 3d fields below σ=0.7 is used Seasonal cycle of GCM total cldfrac, GCM low-cldfrac assuming random overlap(where available), MLM cldfrac, and ISCCP 1990-2000 pres > 680mb.
Results: Current Climate Do the models capture the observed stability/cldfrac relation? OBS OBS Least-Squares Fit Wood & Bretherton (2006) • MLM dcld/dEIS across models, regions, and seasons is very good • GCMs results are poor because of low regional, seasonal variation
Results: EIS as a Climate-Change Predictor Does the observed EIS/cldfrac relation explain future change? • EIS is marginal for GCM Δcld, better for MLM Δcld • EIS is a better predictor for GCMs when averaged over region, season (not shown) • Current-climate dcld/dEISslope is a poor predictor of future climate
Results: MLM vs GCM cldfrac Does the MLM alter our predictions of low cloud change? • Cloud change more positive in MLM (since pts above 1:1 line) • MLM predicts rosier future • MLM and GCM clouds only weakly correlated (ie pts don’t lie parallel to 1:1 line) • MLM does reduce inter-model spread (since spread in y< spread in x) • Direct CO2 effect has little influence mri_cgcm2_3_2a miroc3_2_hires csiro_mk3_0 cccma_cgcm3_1_t63 cnrm_cm3 gfdl_cm2_1 miub_echo_g miroc3_2_medres iap_fgoals1_0_g Low cloud climate change signal from MLM vsGCMs. Climate change is 20c3m yrs 1981-2000 vs sresa1b yrs 2081-2100 with BL radiative cooling reduced 4 W/m2 to mimic CO2 doubling. California Peru Canary Namibia Australia CO2 increase No CO2 effect
Imprinting Do models with less low cloud have conditions which discourage low cloud in the MLM? 700mb ω (mb/day) 700mb q (g/kg) cccma_cgcm3_1_t63 gfdl_cm2_1 miroc3_2_medres inmcm3_0 ipsl_cm4 mri_cgcm2_3_2a California Peru Canary Namibia Australia 2000-2020 2080-2100 DJF MAM JJA SON No. Cloud Frac (%) SST (K) 700mb T (K) • Change in variables is also not related to cloud changes Cloud Frac (%) Low cloud fraction (from monthly data using random overlap) vs forcing variables where imprinting may be expected. Datapoints are 20 yr averages stratified by model, region, season, and date.
Conclusions • The MLM-cloud fraction approach has skill on synoptic timescales • Inter-model cloud variability is generally larger than forcing variability for GCMs • The MLM captures seasonal and regional cldfrac differences which CMIP3 GCMs miss • Interpreting GCM results through a MLM reduces inter-model spread • GCM low cloud bias does not imprint onto the MLM
Future Directions: • Examine other variables (LWP, PBL depth, etc) • Explore (lack of) connection between MLM and GCM results • Identify aspects of GCM forcings which lead to spread in MLM results (through sensitivity tests) • Check if results for CMIP5 are similar
Thanks! contact: caldwell19@llnl.gov
Forcings from GCMs 1. BL depth changes so free-tropospheric (FT) values can’t come from a given level. RH (%) RH (%) Above: RH profiles from ERA-Interim show 850mb is often in the BL at 30N, 130.5W during winter. White line=predicted inversion top. Right: Inversion top (green dot) = the level of max(d2RH/dp2). Least-squares regression is used to find FT slope (red line), which is used to get a FT value if 850mb is found to be in the BL. FT values of T and q are found in this way. • 2. Horizontal advection is unavailable from CMIP data or simple models. • Testing with ERA-Interim suggests that using ∇SST and ∇qs(SST) works quite well • Advection of BL height is challenging and we ended up using v∇zi=0.49mm/day • 3. Daily-resolution subsidence is also not available • Subsidence is computed assuming constant divergence (calculated from 10m winds)
Forcing: Changes in Daily Variability Inter-modelaverage change in standard deviation of MLM forcing between 20th century (1981-2000) and A1B (2081-2100) runs normalized by the standard deviation of current-climate data. Annual cycle removed.
Imprinting Is the change in forcing variables controlled by the change in cloud fraction? Δ700mb ω (mb/day) Δ700mb q (g/kg) cccma_cgcm3_1_t63 gfdl_cm2_1 miroc3_2_medres inmcm3_0 ipsl_cm4 mri_cgcm2_3_2a California Peru Canary Namibia Australia DJF MAM JJA SON ΔCloudFrac (%) No. ΔSST (K) Δ700mb T (K) ΔCloudFrac (%) Change (defined as 2080-2100 – 2000-2020) in low cloud fraction vs change in forcing variables.
Model Validation MLM theory based on short timescales so model should have skill at these scales. Does it? • Canary region tends to be decoupled ⇒ MLM poor • MLMhas low skillat daily scale, decent at weekly+ • Large forcing and obs error at daily scale erode short-term skill • synoptic (~weekly) scale is well predicted Correlation between regional-average cloud fraction from the MLM forced by 2006 ERA-Interim and from ISCCP data as a function of temporal averaging period.
Results: EIS as a Predictor – Averaging Effect GCM skill improves when seasonal and regional differences (which are generally not captured) are removed.
Present-Day Mean Low-Cloud Skill 4x over 2x over matches 2x under 4x under • GCMsoverpredict, MLMsunderpredict • GCMs do poorly for Canary • miroc_medres and iap have conditions hostile to MLM • GCM and MLM values are not correlated • suggests imprinting not a problem • California always well simulated! mri_cgcm2_3_2a miroc3_2_hires csiro_mk3_0 cccma_cgcm3_1_t63 cnrm_cm3 gfdl_cm2_1 miub_echo_g miroc3_2_medres iap_fgoals1_0_g California Peru Canary Namibia Australia GCM MLM Ratio of modeled to ISCCP-observed annual-ave low cldfrac for 1980-2000 conditions
mri_cgcm2_3_2a miroc3_2_hires csiro_mk3_0 cccma_cgcm3_1_t63 cnrm_cm3 gfdl_cm2_1 miub_echo_g miroc3_2_medres iap_fgoals1_0_g Change in low cloud fraction by region and model. MLM output=more solid colors, GCM output = faded colors. GCM output = total cloud. Where present, dots = GCM value using random overlap instead.
Climate Change signal in BL depth • GCM BL depth increases in most models, regions. Namibia Peru California Canary Australia Change in diagnosed inversion height from CMIP3 models (2080-2100 vs 1980-2000)
RH Changes – Methodology Choice • xxx Blue=RH from daily free-trop corrected 850mb values, light blue=RH from climatological free-trop-corrected T and q, and green=RH from climatologicaluncorrected T and q. Bars are averages over regions, dots are individual regional values.
MLM LCF conditioned on joint PDF of LTS and Divergence sresa1b LCF difference 20c3m • MLM cloud fraction is largely set by LTS and div (since colors invariant) • cloud changes due to changes in PDF of LTS and div • LTS dependency on prev slide explained by breadth of LTS distribution here. iap_fgoals_0_g miub_echo_g LCF (%) MLM cloud fraction (colors) and joint PDF of monthly mean LTS and divergence (contours) for California region.
What determines a Model’s low cloud response to climate change • EIS and div (dark blue) explain most of the total cloud change for 6/10 models, but other factors (light blue) are important for many models. • EIS and div increase cloud (averaging over other quantities), while other factors reduce cloud. • Mean cloud fraction is not a strong indicator of cloud change or whether it can be explained by EIS and div or not.
What Determines Inter-Model Spread for Current climate MLM cldfrac • EIS and div again explain differences for 6/10 models • 4 of these 6 are the same as prev slide. • Models with *really* different low clouds are that way because of different EIS,div occurrence. More average models have differences explained by other factors.
GCM Total vs Low Cloud for Sc regions • GCM total cloud ≈ random-overlap low cloud for 3 of the 5 models where this can be checked