Download
1 / 32
320 likes | 495 Views
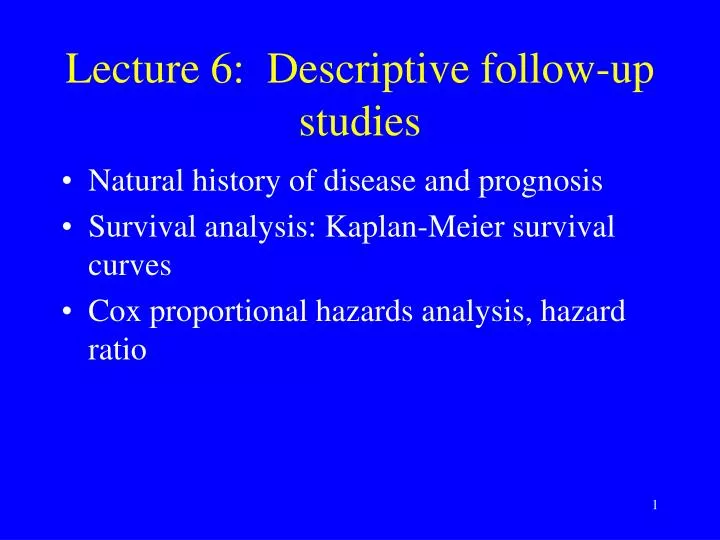
Lecture 6: Descriptive follow-up studies. Natural history of disease and prognosis Survival analysis: Kaplan-Meier survival curves Cox proportional hazards analysis, hazard ratio . Natural history (clinical course) and prognosis of a disease. Why? Patient/family counseling

E N D
Lecture 6: Descriptive follow-up studies • Natural history of disease and prognosis • Survival analysis: Kaplan-Meier survival curves • Cox proportional hazards analysis, hazard ratio
Natural history (clinical course) and prognosis of a disease • Why? • Patient/family counseling • Development and evaluation of interventions • Types of study • Descriptive (persons with the disease only) • Analytical (comparison group) • Prognostic factors (risk factors for poor prognosis)
Natural history/prognosis studies: Aspects of interest • stages of the disease (subclinical, clinical) • outcomes • death • disease (cure, progression) • disability (physical, mental) • distress (pain, other symptoms)
International Classification of Impairments, Disabilities, and Handicaps (ICIDH) • IMPAIRMENT: • ...loss or abnormality of psychological, physiological, or anatomical structure or function. • DISABILITY: • ...restriction or lack (resulting from an impairment) of ability to perform an activity … • HANDICAP: • ...disadvantage... resulting from an impairment or disability, that limits or prevents the fulfillment of a role ….that is normal for that individual….
Measures of mortality/survival • case-fatality rate • survival rate (1-year, 5-year etc) • median survival time • relative survival • survival curves (life-tables)
Measures of disease • Disease definition • diagnostic criteria • clinical measures, pathology etc • Time to key events: • Progression to another stage • Prevalence of disease at specified follow-up time(s)
Measures of disability • Activities of daily living (ADL) • independencein: • basic ADL (e.g., feeding, washing) • instrumental ADL (e.g., telephone, money management) • Sources of information • observation (performance) • self-report • proxy report
Measures of distress • Subjective experience of disease • e.g., pain, discomfort, psychological distress, depressive symptoms • Sources of information • primarily self-report • for subjects unable to self-report, observational methods may be needed
What is time zero? • Date of first symptoms? • Date of detection? • Date of diagnosis? • Beware of differences in “time zero”between study groups: • screening/early detection intervention shifts time zero • intervention appears to lengthen time to outcome without real change in prognosis • “lead time” bias
Example: evaluation of the effectiveness of breast cancer screening (HIP study) • Possible outcomes: • survival rate (1 year, 5 year) • case-fatality rate • mortality rate • Which is most appropriate?
Computation of lead-time of breast cancer screening (HIP study) • using relationship between incidence, prevalence and mean duration • data available: • incidence rate of clinical breast cancer = 1.84/1,000 per year • prevalence of pre-clinical breast cancer (from screening) = 2.73 per 1,000 • average duration of pre-clinical breast cancer = 2.73/1.84 = 1.48 years • assumption: on average, patients are detected halfway through the pre-clinical stage • lead-time = duration of pre-clinical stage = 1.48/2 = 0.74 years 2
Life-table methods: why are they needed? • Not needed if all members of a cohort have complete follow-up to death • Patients drop out of follow-up studies: • how should they be treated? • At any point in time in a study, patients have been followed for different periods of time
Censoring of follow-up data • Censoring: loss of subjects from follow-up at time when outcome of interest has not occurred: • Death • Enrolled too recently • Did not complete follow-up interview: • moved away • refused • could not contact • did not attend follow-up appointment • Assumption: Reason for censoring is independent of the outcome of interest
Types of life-tables • Kaplan-Meier (clinical) life tables: • exact time to outcome is known • Actuarial (population) life tables: • exact time to outcome unknown • outcome occurs in interval • estimation of average time to outcome within interval
Summarizing survival-type data • Mean or median? • Absolute or relative?
Cox proportional hazards analysis • Multivariate technique, allowing adjustment for covariates (confounding variables) • Similar to multiple logistic regression, except that dependent variable is time to outcome • Hazard ratio (HR) interpretation similar to risk ratio
Example: Prognosis of delirium • Study population: hospitalized patients aged 65+ • Time zero: hospital admission • Outcomes: • survival (over 1 year) • cognitive impairment and disability (at 2, 6, 12 months)
Selection of cohorts • Delirium cohort (n=243): patients meeting CAM criteria (DSM-IIIR) for delirium either at enrolment (prevalent cases) or during next week (incident cases) • Control cohort (n=118): selected from patients without delirium, with weighted sampling to reduce confounding by dementia.
Mortality by delirium and dementia (adjusted) Hazard ratios and 95% confidence intervals: • No delirium or dementia 1.0 • Delirium no dementia 3.77 (1.30-10.20) • Dementia no delirium 1.57 (0.52 - 4.71) • Both 1.98 (0.76 - 5.05)
Example: effect of drug abuse rehabilitation programs on time to first drug use • 2 concurrent randomized controlled trials of residential drug abuse treatment programs of different planned duration: • traditional therapeutic community (TC) • abstinence-oriented • 6 vs 12 months • modified TC with relapse prevention approach • relapse prevention/health education orientation • 3 vs 6 months
Example: effect of drug abuse rehabilitation programs on time to first drug use • PRIMARY OUTCOME: time to first drug use (measured at follow-up interviews) • PROBLEM: • high rates of attrition from treatment • patients assumed drug-free during treatment • TIME ZERO? • Date of admission? • Date of discharge/exit
Methodological Questions • Censoring: • loss to follow-up: • outcome or censored data? • Decision on time zero: • primary analyses using admission, secondary analyses using exit • Decision on censoring: • primary analyses: censoring of loss to follow-up • secondary analyses: loss to follow-up considered to have used drugs on day after exit from program