Download
1 / 50
501 likes | 521 Views
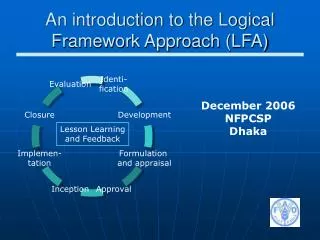
Understand the Logical Framework Approach (LFA) methodology to enhance project planning, design, management, and performance assessment. Learn the steps involved and the importance of problem, stakeholder, and objectives analysis.

E N D
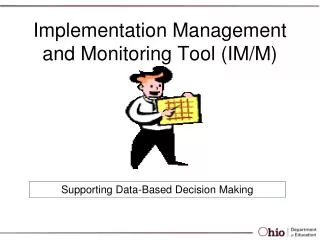
The Logical Framework as an Implementation and Monitoring Tool RBEC Environment & Energy Practice Workshop Almaty, Kazakhstan. 6-9 October 2004 John Hough, UNDP GEF BD PTA
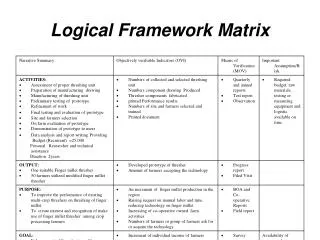
Reminder: The LogFrame is an Approach not a Matrix • Methodology -including a set of tools- to structure and facilitate: • project planning • project design • project management • project performance assessment
Benefits LFA contributes to: • structured project design process- logical sequence • transparency- clear objectives, side effects • participation- ownership, sustainability • consistent project strategy • assessment of performance- indicators (ex-post & during implementation)
Basic Steps and Elements • Problem Analysis • Stakeholder Analysis • Objectives Analysis • Analysis of Alternatives • Project Planning • Project Planning Matrix (PPM) (the “logframe”)
Problem Analysis • Establishing “cause and effect” relationships – a “problem tree” • “lack of the solution is not the root cause of the problem”! • Identifying “lack of knowledge” as the problem means that the solution is already pre-determined: ie. “provide knowledge” • Getting people to focus on what they need to do vs. what they want to do is often the biggest challenge in project development • Solution Driven Analysis often leads to solving the wrong problem
Lessons learned 1. Doing “good work” or “achieving impact”? 2. “Seeing the wood for the trees”
Problem Analysis • Stakeholder Analysis
Stakeholder Analysis • Problem Analysis cannot be done without Stakeholder Consultation. • Every stakeholder views the problem from a different angle. • Problem analysis and stakeholder identification and analysis are iterative processes, progress in one almost always means returning to the other.
Problem Analysis • Stakeholder Analysis • Objectives Analysis
Objectives Analysis • What is the project “going after”? • What are the indicators?
Problem Analysis • Stakeholder Analysis • Objectives Analysis • Alternative Analysis
Alternative Analysis Systematic search for the best project approach. • What outcomes are required to reach the objective? • How best to reach each outcome? • What outputs are required to reach each outcome? • What activities are required to achieve each output? • Set up criteria for assessment of alternatives, such as: • resources available • political feasibility • social impact
Fundamental Project Design Outcome 1 + Outcome 2 + Outcome 3 = Objective
Lesson Learned • there should be no spare outcomes • nor should there be any outcomes that are not essential for the achievement of the objective
In the logical logframe matrix we simply list the outcomes vertically Objective = Outcome 1 + Outcome 2 + Outcome 3
Assumptions • Conditions that are necessary for the success of the project, but which are not under the direct influence of the project. • Assess conditions according to importance and probability • Need to be monitored / risks • Pay attention to “killer assumptions” (= need to re-design project)
Assumptions vs. Risks • Assumptions tend to be positive eg. “a supportive piece of legislation is passed” • Risks tend to negative eg. “increased pressure on a protected area as a consequence of a resettlement programme” • Assumptions can be formulated negatively as risks, and vice versa – risks as assumptions • Assumptions are generally identified during project design • Risks often appear during project implementation
Converting Assumptions to Outcomes through Cofinancing • If a condition required through an assumption can be brought under the influence of the project, then it becomes a project outcome. • The costs of achieving that outcome would count as co-financing
Listing these vertically in a logical logframe matrix we get: • Objective • = Outcome 1 • + Outcome 2 • + Outcome 3 • + Assumption 1 • + Assumption 2
Similarly these are written vertically: • Outcome 1 • = Output 1 • + Output 2 • + Output 3 • + there may be assumptions at this level too!
3.Basic Steps and ElementsPlanning PhaseProject Planning Matrix (PPM)
ie. the logframe matrix combines the vertical and horizontal logic • Objective • = Outcomes 1+2+3 + Assumptions • = Outputs 1+ 2+ 3+4 + Assumptions • = Activities 1+2+3+4 + Assumptions
3.Basic Steps and ElementsPlanning PhaseProject Planning Matrix (PPM)
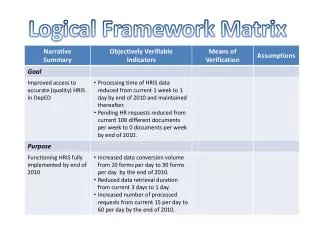
Project Planning or “LogFrame” Matrixis a “Summary” of the Project • WHY the project is carried out (development objective, immediate objectives) • WHATthe project is supposed to produce (outputs) • HOWthe project is going to achieve the outputs (activities) • HOWthe success of the project can be measured (indicators) • WHERE the data can be found (means of verification) • WHICH external factors influence the project (assumptions) • WHICH inputs are required for the project (inputs/budget)
In a logframe we are not very interested in activities • Activities are the means to an end • We are interested in “ends” or “impacts” • Summarize the activities in the logframe • Overloading the logframe with activities is confusing, and also a waste of effort since they are likely to change in the light of project circumstances • Activities are detailed in a project management annual activity workplan
Lesson learned GEF Projects tend to be “overdesigned” • They place far too much emphasis on “activities” • There is too much emphasis on measuring or counting outputs and activities
GEF Strategic Business PlanDirections and Targets (GEF/C.21/ Inf.11) The SP’s are what we are “going after” • GEF Strategic Priority / Target • Project Objective / Target • Project Outcomes / sub-Targets • Review the impact indicators associated with these
A word on terminology Development Goal = what the project contributes to, but does not on its own achieve Project Objective = what the project is accountable for delivering Project Outcomes = the constituent elements of a project. The sum of the project outcomes = the project objective
Project targets are rolled up to achieve the SP targets SP1.Target 2: x (y%) countries show improvements in management effectiveness (policy, legislation, capacity, budgets) = Improvements in country 1 + Improvements in country 2 + etc
ie. the Traditional Logframe Matrix and the Results Measurement Framework are easily combined
Using the logframe as an implementation and monitoring tool “Seeing the forest for the trees” • Focuses on targets and impacts, not activities or outputs • Enables us to revisit the “alternatives” and adjust the activities or outputs on a regular basis • Adaptive management
Objectives of Alternative Projects: • Reduced Fishing Intensity • Increased Fish Populations • MUMPA’s • Regulations • Demarcation • Staffing • Decision Making • Financial Tools
Good Indicators • Indicator is a quantitative or qualitative variable or parameter that provides a simple and reliable basis for assessing change or performance (the objective or outcome). • Verifier. Variable or parameterthat retains the essential meaning of the objective and that can be measured on the ground. • Qualifier. Contribute to describe the verifier allowing to respond to: what, when, where, who • Targets/ Baseline- values associated to the verifiers that define how much the objective is planned/expected to be achieved compared to the situation prior to project start. Intermediate targets (milestones) allow assessment of progress.
Example of a Good Indicator Objective: “Conservation of keystone species” Indicator: • At the end of the fifth year (qualifier: when) • the population sizes (qualifier: what) • of species A, B and C (verifier) • within the boundaries of the park (qualifier: where) • have remained constant (target) • compared to X number at project-start level (baseline)
Lesson Learned - Procrastination • Project designers defer measuring indicators to the inception phase • The inception phase defers measuring indicators to project implementation • Project implementation defers measuring indicators to the mid-term evaluation • The mid-term evaluation defers measuring indicators to the second half of project implementation • Project implementation defers measuring indicators to the final evaluation • The final evaluators say “we cannot prove this project has achieved anything”