Download
1 / 6
60 likes | 73 Views
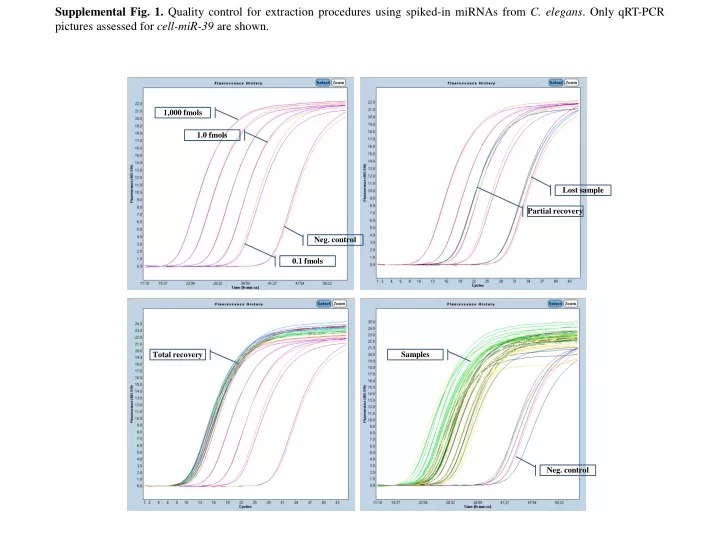
Supplemental Fig. 1. Quality control for extraction procedures using spiked-in miRNAs from C. elegans . Only qRT-PCR pictures assessed for cell-miR-39 are shown. 1,000 fmols. Total recovery. 1.0 fmols. Neg. control. 0.1 fmols. Samples. Lost sample. Neg. control. Partial recovery.

E N D
Supplemental Fig. 1. Quality control for extraction procedures using spiked-in miRNAs from C. elegans. Only qRT-PCR pictures assessed for cell-miR-39 are shown. 1,000 fmols Total recovery 1.0 fmols Neg. control 0.1 fmols Samples Lost sample Neg. control Partial recovery
Supplemental Fig. 2. Distribution of miRNA expression based on the quality after removing all miRNAs with Ct values ≥35 and cluster analysis heatmap plot according to the quality of all determinations. A slightly tendency of the majority of morbid obese (BMI>40 kg/m2) men expressing higher number of miRNAs with a Ct value below 35 Ct was reported. NW (green): Nomalweight, OW (yellow): Overweight, Ob (orange): Obesity, and MOb (red): Morbid obesity. * (violet) indicates subjects with type 2 diabetes.
Supplemental Fig. 3. Distribution of miRNA expression based on the quality after removing all miRNAs with Ct values ≥35, and cluster analysis heatmap plot according to the quality of all determinations. The tendency of the morbid obese (BMI>40 kg/m2) subjects expressing higher number of miRNAs with a Ct value below 35 Ct before surgery weight-loss (red) was also shown.
Supplemental Fig. 4. Gene expression stability measure (M, which is the mean pair-wise variation for a gene from all other tested control genes) calculated using the applet GeNorm according to the number of reference miRNAs.
Supplemental Fig. 5. Scatter plot representing for the whole cohort (n=80) the correlation between the normalized expression values (even Log2-normalized relative values, or the anti-Log2-transformed DeltaCps values of the means) for (A) miR-142-3p, (B) miR-140-5p, (C) miR-222, (D) miR-221, (E) miR-15a, (F) miR-520c-3p, (G) miR-423-5p, and (H) miR-130b. Values for non-obese men (the reference group) are represented as empty circles (○); obese (30≤ BMI< 40 kg/m2) subjects are represented as empty diamonds (◊); and morbid obese (BMI≥ 40 kg/m2) patients as filled diamonds (). r=0.44 p<0.0001 r=0.37 p<0.0001 r=0.42 p<0.0001 r=-0.42 p<0.0001 A B C D r=-0.41 p<0.0001 r=-0.57 p<0.0001 r=-0.44 p<0.0001 r=-0.32 P=0.004 E F G H
Supplemental Fig. 6.Hierarchical clustering (Ward’s criterion) deduced from the qRT-PCR data using independent hydrolysis probes and miRNAs profiles depicting genomic relatedness among the subjects of the whole cohort. NW (green): Normoweight, OW (yellow): Overweight, Ob (orange): Obesity, and MOb (red): Morbid obesity. * (violet) indicates subjects with type 2 diabetes.