Download

1 / 40
400 likes | 470 Views
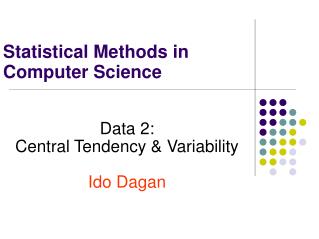
You can calculate: Central tendency Variability You could graph the data. You can calculate: Central tendency Variability You could graph the data. Bivariate Distribution. Positive Correlation. Positive Correlation. Regression Line. Correlation. r = 1.00. Regression Line. r = .64.

E N D
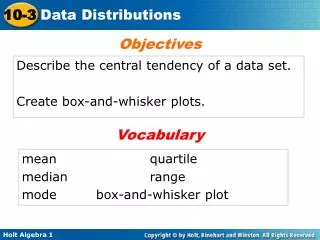
You can calculate: Central tendency Variability You could graph the data
You can calculate: Central tendency Variability You could graph the data
Correlation r = 1.00
Regression Line . . . . . r = .64
Regression Line . . . . . r = .64
Negative Correlation r = - 1.00
Negative Correlation . . . r = - .85 . .
Zero Correlation . . . . . r = .00
Correlation Coefficient • The sign of a correlation (+ or -) only tells you the direction of the relationship • The value of the correlation only tells you about the size of the relationship (i.e., how close the scores are to the regression line)
Which is a bigger effect? r = .40 or r = -.40 How are they different?
Interpreting an r value • What is a “big r” • Rule of thumb: Small r = .10 Medium r = .30 Large r = .50
Practice • Do you think the following variables are positively, negatively or uncorrelated to each other? • Alcohol consumption & Driving skills • Miles of running a day & speed in a foot race • Height & GPA • Forearm length & foot length • Test #1 score and Test#2 score
Practice • Page 102 • #5.8 • Page 96 • #5.5 1) Draw a scatter plot 2) Estimate the correlation
5.8 • A) -.60 • B) -.95 • C) .50 • D) .25
. . . . .
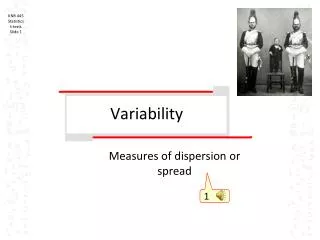
Statistics Needed • Need to find the best place to draw the regression line on a scatter plot • Need to quantify the cluster of scores around this regression line (i.e., the correlation coefficient)
Correlation Coefficient • A correlation coefficient provides a quantitative way to express the degree of relationship between two variables • There are 3 different formulas presented in the book • Z-score formula is a good way to see “what's going on” -- page 93
Blanched Formula r = XY = product of each X value multiplied by its paired Y value X = mean of variable X Y = mean of variable Y Sx = standard deviation of variable X Sy = standard deviation of variable Y N = number of pairs of observations
Blanched Formula r = XY = 84 X = 3.0 Y = 4.6 Sx = 1.41 Sy = 2.41 N = 5
Blanched Formula 84 r = XY = 84 X = 3.0 Y = 4.6 Sx = 1.41 Sy = 2.41 N = 5
Blanched Formula 84 3.0 4.6 r = XY = 84 X = 3.0 Y = 4.6 Sx = 1.41 Sy = 2.41 N = 5
Blanched Formula 84 3.0 4.6 5 r = 1.41 2.41 XY = 84 X = 3.0 Y = 4.6 Sx = 1.41 Sy = 2.41 N = 5
Blanched Formula 84 3.0 4.6 16.8 13.8 5 r = 1.41 2.41 XY = 84 X = 3.0 Y = 4.6 Sx = 1.41 Sy = 2.41 N = 5
Blanched Formula 84 3.0 4.6 16.8 13.8 3.00 5 r = .88 2.41 3.40 1.41 XY = 84 X = 3.0 Y = 4.6 Sx = 1.41 Sy = 2.41 N = 5
. . . . . r = .88