Download
1 / 52
520 likes | 614 Views
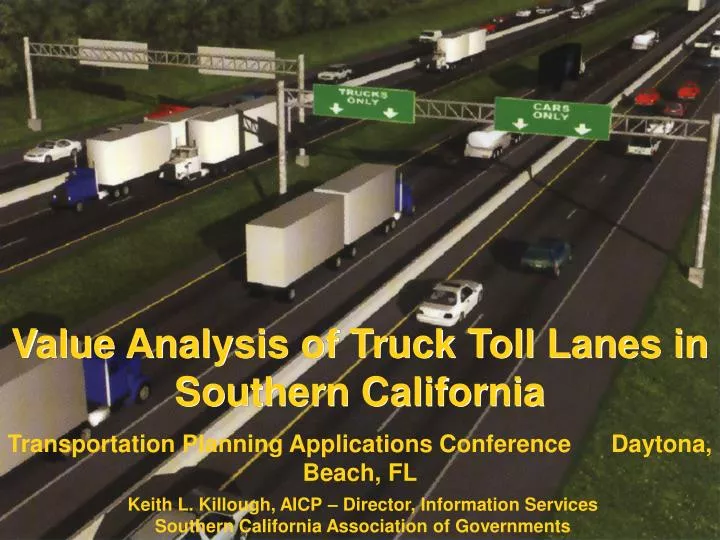
Value Analysis of Truck Toll Lanes in Southern California. Transportation Planning Applications Conference Daytona, Beach, FL. Keith L. Killough, AICP – Director, Information Services Southern California Association of Governments. Presentation Overview. Background & Problem Statement

E N D
Value Analysis of Truck Toll Lanes in Southern California Transportation Planning Applications Conference Daytona, Beach, FL Keith L. Killough, AICP – Director, Information Services Southern California Association of Governments Southern California Association of Governments Resolving Regional Challenges
Presentation Overview • Background & Problem Statement • Reliability Methodology • Methodology Application • Investment Assessment • Conclusions Southern California Association of Governments Resolving Regional Challenges
LA/Long Beach Port Complex is Largest in the U.S. and 5th in the World Southern California Association of Governments Resolving Regional Challenges
Over 70% of imports pass through to other markets Ports handle one third of all container traffic in U.S. and nearly two-thirds of containers from Asia Southern California Association of Governments Resolving Regional Challenges
16% 1 out of 12 jobs in 2003 14% 12% 10% 8% 8.1 6% 4% 2% 0% Logis-tics The Logistics Industry Provides Jobs to 8% of Southern Californians % SCAG Jobs 14.9 14.1 12.1 10.6 9.6 7.5 4.8 3.5 1.7 Motion Picture Constr. Financial Activities Educ. & Health Services Manf. Prof. & Bus. Services Gov’t. Other Services Leisure andHosp.
1 of highest paying $1600 $1400 $1200 $1000 $800 $847 $600 $400 $200 0$ Logistics And Those Jobs Pay Well $ Weekly Pay $1353 Average weekly pay for all industries is $749 $1194 $866 $843 $811 $777 $718 $413 $400 Educ. & Health Services Constr. Prof. & Bus. Services Manf. Gov’t. Financial Activities Motion Picture Leisure and Hospitality Other Services Southern California Association of Governments Resolving Regional Challenges
I-710 Typical Day I-710 During 2002 Port Lockout Challenge: CongestionGoods movement is a major contributor to traffic congestion and a bottleneck to future growth. Southern California Association of Governments Resolving Regional Challenges
RevisedEstimate 44.7 36.0 18.3 13.2 9.5 Total LA/Long Beach Container GrowthProjected to Triple in 25 Years In Million TEU’s(20’ Equivalent Units) 25.2 23.4 12.3 9.0 Original Estimate 6.9 1999 2005 2010 2020 2030 Source: POLA, POLB Southern California Association of Governments Resolving Regional Challenges
Projected to nearlydouble Without improvements, nothing will be moving Congestion Jeopardizes Our Economic Advantage By 2025 Southern California Association of Governments Resolving Regional Challenges
Associated Pollution Has Created a Health Crisis • The region continues to have the worst air quality in the U.S. • Particulate emissions from ships, locomotives & planes from the ports are projected to increase Southern California Association of Governments Resolving Regional Challenges
400-600 600-800 Estimated Risk of Cancer from Airborne Toxics: Excluding Diesel Source: SCAQMD, Multiple Air Toxics Exposure Study II, March 2000 100-200 200-300 300-400 Cancersper million Southern California Association of Governments Resolving Regional Challenges
600-800 800-1000 Over1200 1000-1200 Estimated Risk of Cancer from Airborne Toxics: Including Diesel Source: SCAQMD, Multiple Air Toxics Exposure Study II, March 2000 300- 400 400-600 200-300 Cancers per million Southern California Association of Governments Resolving Regional Challenges
Diesel Particulates Are at the Root of the Problem 52% of national exposure to PM2.5 in excess of the federal standard occurs in the South Coast Air Basin 5,400 annual cases of premature death are attributable to this exposure Source: South Coast Air Quality Management District & California Air Resources Board 2007 Southern California Association of Governments Resolving Regional Challenges
Heavy Duty Diesel Truck Particulate Speed Correction Factors Source: California Air Resources Board, 2007 EMFAC Model Southern California Association of Governments Resolving Regional Challenges
Not Nearly Enough Federal and State Funds to Fix the Problems • Dramatic growth in traffic is running head-long into limited transportation funding and high infrastructure improvement costs. Southern California Association of Governments Resolving Regional Challenges
Does investment required to make transportation infrastructure improvements & employ clean air strategies make business sense? Southern California Association of Governments Resolving Regional Challenges
Two Productivity Gains • Shippers’ inventory savings • Transporters’ efficiency gains Southern California Association of Governments Resolving Regional Challenges
Carrying Less Inventory Saves Money 35% Less Inventory U.S. Inventory to Sales Ratios: 1985 - 2004 Southern California Association of Governments Resolving Regional Challenges
Key Study Finding: Shippers are more sensitive to congestion (delay) than to the cost of transportation Port & Modal Elasticity Study Study Conducted by Leachman and Associates LLC - Sept. 2005 Southern California Association of Governments Resolving Regional Challenges
“Just-In-Time” Savings The trans-loading of weekly shipments from Asia affords large, nation-wide retailers an 18-20% reduction in their total pipeline plus safety stock inventory compared to direct shipping from Asia. Assuming a 6% average error in nationwide one-week-ahead sales forecasts Leachman & Associates LLC Southern California Association of Governments Resolving Regional Challenges
Nation-wide order placed with Asian Factory Fewer ships to selectTrans-Loading Ports Depart Destination Ports Arrive at Destinations Retail Stores Goods can be allocated just before vessel arrives ORDER DAYS OUT: 5 - 9 1- 9 75 - 100 25 - 37 Average of one month advantage Allocated Only6 - 18 Days Out Consolidated Shipping Time Savings Leachman & Associates LLC Southern California Association of Governments Resolving Regional Challenges
“Just-In-Time” Savings The savings amount to over $1 Billion annually on inventory interest alone. Leachman & Associates LLC Southern California Association of Governments Resolving Regional Challenges
Reliability Methodology Southern California Association of Governments Resolving Regional Challenges
The Value of Time $25 to $200 per hour depending on cargo Trucking Industry Value of time • FHWA Freight Management and Operations: • Measuring Travel Time in Freight-Significant Corridors • www.ops.dot.gov/freight/time.htm Southern California Association of Governments Resolving Regional Challenges
Reliability Assessment Definitions • Travel Time Index:Ratio of the average travel time to the uncongested travel time. • Planning Time Index:95th percentile of the Travel Time Index. Extra time most travelers include when planning peak period trips. • Buffer Time Index:The extra time (buffer) needed to ensure on-time arrival for most trips. Southern California Association of Governments Resolving Regional Challenges
5 AM 6 AM 7 AM 8 AM 9 AM Travel Time 10 AM Buffer Time to ensure on-time arrival for most trips 11 AM 12 PM 1 PM 2 PM 3 PM 4 PM 5 PM 6 PM 7 PM 8 PM 9 PM 10 PM Planning Time in 2030 Index by Time-of-Day Time of Day (non-holiday weekdays) Mobility Monitoring Program Texas Transportation Institute. FHA % more time 10 110 20 30 40 50 60 70 80 90 100 Southern California Association of Governments Resolving Regional Challenges
Freeway Travel Rate Principal Arterial Street Travel Rate Principal Arterial Street Peak Period VMT Freeway Peak Period VMT x + x Freeway Free-flow Rate Principal Arterial Street Free-flow Rate Travel Time Index Buffer Time Index Freeway Peak Period VMT Principal Arterial Street Peak Period VMT + Average Travel Rate(in minutes per mile) 95th Percentile Travel Rate(in minutes per mile) Weighted Average of All Sections (using VMT) - x 100% Average Travel Rate(in minutes per mile) Travel Time Index Buffer Time Index Southern California Association of Governments Resolving Regional Challenges
Caltrans PeMS Sensor Locations Southern California Association of Governments Resolving Regional Challenges
SCAG Travel Time ReliabilityA.M. Peak Morning Peak Period (6a - 9a) 140% Buffer Time Index = 1.3178Ln(Travel Time Index) + 0.0972 R2 = 0.6986 120% 100% 80% Buffer Time Index (Reliability) 60% 40% 20% 0% 1.0 1.1 1.2 1.3 1.4 1.5 1.6 1.7 1.8 1.9 2.0 Travel Time Index (Congestion Level) Southern California Association of Governments Resolving Regional Challenges
SCAG Travel Time Reliability Mid-day Midday Period (9a - 4p) 140% Buffer Time Index = 2.162Ln(Travel Time Index) + 0.0953 R2 = 0.6304 120% 100% Buffer Time Index (Reliability) 80% 60% 40% 20% 0% 1.0 1.1 1.2 1.3 1.4 1.5 1.6 1.7 Travel Time Index (Congestion Level) Southern California Association of Governments Resolving Regional Challenges
Methodology Application Southern California Association of Governments Resolving Regional Challenges
The investments and their price tags Southern California Association of Governments Resolving Regional Challenges
Dedicated Truck Lanes 2 Truck Lanes inEach Direction I - 15 86.0 miles East/West 37.8 miles I - 710 18.0 miles Southern California Association of Governments Resolving Regional Challenges
Separated from Car Lanes Dedicated Right-of-Ways or Elevated Roadway Southern California Association of Governments Resolving Regional Challenges
$20.0 $3.5 $6.0 $2.6 $26.0 TOTAL $36.0 TOTAL with $10B Environmental Mitigation The Cost In Billions Other Operational Improvements Lanes/Tracks Only TOTAL Dedicated Truck Lanes $16.5 Additional Rail Tracks $3.4 Southern California Association of Governments Resolving Regional Challenges
Methodology Application • Year 2030 Planning Design Year • SCAG Regional Travel Simulation Model Analysis • No Project Alternative • Truck Toll Lane Alternative: 2 lanes each direction • Toll Cost = $0.86/mile • I-710 Long Beach Freeway • SR 60 Pomona Freeway • I-15 (Ontario to Victorville) • Compare toll costs to travel time & reliability savings based on trucking industry value-of-time Southern California Association of Governments Resolving Regional Challenges
The Public/Private Solution Container Fees & Tolls toUSEthe facilities AFTERthey are built Tax-ExemptBonds and Tax Credit Financing toBUILDthe facilities Southern California Association of Governments Resolving Regional Challenges
What are speed and reliability worth to users of the system? Southern California Association of Governments Resolving Regional Challenges
4.7 2.0 7.6 1.5 .5 4.8 Hours: Travel Time In the Year 2030 AM Peak Travel Planning Time in Hours Ontario Victorville LA Business District Hours: With Truck Lanes Southern California Association of Governments Resolving Regional Challenges
Truckway vs No Project Speed Changes on Auto Traffic Lanes Speed Changes Southern California Association of Governments Resolving Regional Challenges
$233 $103 $345 Extra Trip Potential 3.1 3.4 2.3 Cash Value of Time Savingswith Truck Lanes AM Peak Travel @$73 per hour Ontario Victorville LA Business District Value: Southern California Association of Governments Resolving Regional Challenges
If truckers paid an $.86/mile toll to use the truckways, what would be the ROI? Southern California Association of Governments Resolving Regional Challenges
Time Value Savings Toll @ $.86/Mile ROI Ratio $86$101 $17$17 6:17:1 $201$329 $32$32 7:111:1 $281$336 $64$64 5:18:1 Return on Investment at A.M. Peak Travel Times - 2030 Value @ $73/hr WarehouseDistrict ToFrom $103$118 Downtown ToFrom $233$361 Ontario ToFrom $345$490 Victorville Southern California Association of Governments Resolving Regional Challenges
$1 Invested = $5 to $11 Return Southern California Association of Governments Resolving Regional Challenges
Premise 1.Infrastructure improvements will reduce transit time for shippers and improve efficiency and reliability. 2.Reliability has a real dollar value to shippers. 3.The value of the time saved will be significantly greater than the investment to achieve the time saved. Southern California Association of Governments Resolving Regional Challenges
As-Is Scenario Fees imposed but NOT used to provideregional congestion relief Congestion Relief Scenario Fees and/or tolls paid by users of newly constructed highway and rail systems that provide regional congestion relief. Two “What-If” Scenarios Study Conducted by Leachman and Associates LLC - Sept. 2005 Southern California Association of Governments Resolving Regional Challenges
5.0 Fairly inelastic until fees in the $180 range are introduced 4.5 4.0 Total Volume 3.5 3.0 2.5 Much more inelastic than direct shipping Trans Loading Volume 2.0 1.5 1.0 0.5 Fees Imposed with NoInfrastructure Improvements FEUs in millions 2004 Annual Volume Container Fee (per FEU) in dollars $30 60 90 120 150 180 210 240 270 300 330 360 390 420 450 480 Southern California Association of Governments Resolving Regional Challenges
5.0 Congestion relief makes ports more attractive 4.5 Total Volume At $200, volume is only 4.3% below No Fee:No Improvement Scenario 4.0 3.5 3.0 Trans-load volume is even higher Trans Loading Volume 2.5 2.0 1.5 1.0 0.5 $30 60 90 120 150 180 210 240 270 300 330 360 390 420 450 480 Private Sector Investment inCongestion Relief FEUs in millions 2004 Annual Volume Container Fee (per FEU) in dollars Southern California Association of Governments Resolving Regional Challenges
Observations & Considerations • Travel time reliability can be more important to freight movement than the actual travel time • Return on Investment ratios vary by facility & time of day • A combination of truck toll fees & additional funds will likely be required to cover facility capital costs • Additional options being explored: • Maglev Freight System • Electrified rail & highway systems Southern California Association of Governments Resolving Regional Challenges
Conclusions • Goods movement is critical to the economies of Southern California & the nation • Goods movement particulate emissions contribute to the regional health crisis • Speed & reliability enhancements benefit goods movement & reduce health impacts • Reliability is measurable • Reliability improvements will offset toll costs Southern California Association of Governments Resolving Regional Challenges