Download
1 / 32
320 likes | 501 Views
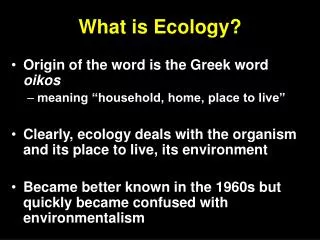
Topic 5: Ecology and Evolution. 5.3 Populations. 5.3.1 Outline how population size is affected by natality, immigration, mortality and emigration. Factors that increase population size : Natality is recruitment to a population through reproduction

E N D
Topic 5: Ecology and Evolution 5.3 Populations
5.3.1 Outline how population size is affected by natality, immigration, mortality and emigration. • Factors that increase population size: • Natality is recruitment to a population through reproduction • Immigration from external populations e.g. Bird migration http://www.huffingtonpost.com/2009/09/30/fall-migration-animal-mig_n_303108.html http://photography.nationalgeographic.com/photography/
5.3.1 Outline how population size is affected by natality, immigration, mortality and emigration. • Factor reducing population size: • Mortality which is the death rate from any source e.g. predation • Emigration, where individuals leave the population for another habitat http://ngm.nationalgeographic.com/ngm/photo-contest/2012/entries/200431/view/ http://www.ypte.org.uk/environmental/migration-why-do-animals-migrate-/106
5.3.1 Outline how population size is affected by natality, immigration, mortality and emigration. • Factor affectingpopulation size: • Natality is recruitment to a population through reproduction • Immigration from external populations e.g. Bird migration • Mortality which is the death rate from any source e.g. predation • Emigration, where individuals leave the population for another habitat
5.3.2 Draw and label a graph showing a sigmoid (S-shaped) population growth curve. http://www.ibguides.com/biology/notes/populations
5.3.2 Draw and label a graph showing a sigmoid (S-shaped) population growth curve. • Model of population growth: • This models shows the changes in the population size against time. In this model the population is expanding into a habitat offering initial low resistance or low limiting factors • 1) Exponential Phase of rapid population growth rate • 2) Transitional Phase - a slowing yet still high growth rate against time or generations • 3) Plateau stage in which the population remains stable with time. There maybe slight oscillations in the numbers
5.3.2 Draw and label a graph showing a sigmoid (S-shaped) population growth curve. • Exponential Phase: • With low or reduced limiting factors the population expands exponentially into the habitat. • The population may be increasing at 2n where n= number of generations.
5.3.2 Draw and label a graph showing a sigmoid (S-shaped) population growth curve. • Exponential Phase: • The rate of natality + immigration is greater than mortality + emigration. • Note that it does not mean that death/ emigration= 0
5.3.2 Draw and label a graph showing a sigmoid (S-shaped) population growth curve. • Exponential Phase: • This would be typical of a population of germinating annual plants in a new season. http://www.nsis.org/gallery/pl-daisy.html
5.3.2 Draw and label a graph showing a sigmoid (S-shaped) population growth curve. • Exponential Phase: • Another example would be a bacterial population during the initial phases of an infection. http://lib.jiangnan.edu.cn/ASM/116-6.jpg
5.3.2 Draw and label a graph showing a sigmoid (S-shaped) population growth curve. • Exponential Phase: • The population of any species occupying a previously unoccupied habitat (succession) http://www.marietta.edu/~biol/biomes/succession.htm
5.3.2 Draw and label a graph showing a sigmoid (S-shaped) population growth curve. • Summary: • Exponential phase: • Rapid increase in population growth. • Natality rate exceeds mortality rate. • Abundant resources available. (food, water, shelter) • Diseases and predators are rare.
5.3.2 Draw and label a graph showing a sigmoid (S-shaped) population growth curve. • Transition Stage: • Resources are reduced and become limiting in the growth of the population: • As a population grows then there will be increased competition between the individuals of that population for the same resources. • This competition means that some individuals will obtain resources and survive and others will not. http://www.biotopics.co.uk/newgcse/pics/kingpenguincolony.jpg
5.3.2 Draw and label a graph showing a sigmoid (S-shaped) population growth curve. • Transition Stage: • Resources are reduced and become limiting in the growth of the population: • Overall the effect is to produce a lower rate of population increase than observed during the exponential phase. http://www.biotopics.co.uk/newgcse/pics/200410815336186zebra%20and%20oryx.jpg
5.3.2 Draw and label a graph showing a sigmoid (S-shaped) population growth curve. • Transition Stage: • Notice the link here between ecology and evolutionary theory. • There will not just be a reduced rate of population growth but also a selection (survival and reproduction) of those individuals within the population best suited to using and accessing the resources. http://www.biotopics.co.uk/newgcse/pics/Tfern2.jpg
5.3.2 Draw and label a graph showing a sigmoid (S-shaped) population growth curve. • ''........can we doubt (remembering that many more individuals are born than can possible survive) that individuals having any advantage, however slight, over others, would have the best chance of surviving and procreating their kind? On the other hand, we may feel sure that any variation in the least injurious would be rigidly destroyed. This preservation of favourable variations and the rejection of injurious variations, I call Natural Selection'Darwin C. (1859)The Origin of Species http://www.topfoto.co.uk/gallery/darwin/ppages/ppage6.html
5.3.2 Draw and label a graph showing a sigmoid (S-shaped) population growth curve. • Summary: • Transitional phase: • Natality rate starts to fall and/or mortality rate starts to rise. • There is a decrease in the number of resources. • An increase in the number of predators and diseases. • Population still increasing but at a slower rate.
5.3.2 Draw and label a graph showing a sigmoid (S-shaped) population growth curve. • The Population plateau is where the population remains constant over time/ generations • A constant population means that Natality + Immigration = Mortality + Emigration • The population size is determined by the carrying capacity of the habitat at that point in time
5.3.2 Draw and label a graph showing a sigmoid (S-shaped) population growth curve. • In an ecological sense, carrying capacity refers to the maximum population of a given species set by environmental restrictions like food and habitat variables. http://www.ehow.com/facts_7260360_animal-behavior-restriction-carrying-capacity.html
5.3.2 Draw and label a graph showing a sigmoid (S-shaped) population growth curve. • For example, a given mountain range might have the resources to support 10,000 elk; roughly speaking, that would be the range's carrying capacity for elk. • While some carrying capacity factors are external to the animal, its behavior can conceivably play a role. http://www.ehow.com/facts_7260360_animal-behavior-restriction-carrying-capacity.html
5.3.2 Draw and label a graph showing a sigmoid (S-shaped) population growth curve. • Summary: • Plateau phase: • No more population growth, population size is constant. • Natality rate is equal to mortality rate. • The population has reached the carrying capacity of the environment. • The limited resources and the common predators and diseases keep the population numbers constant.
5.3.3 Explain the reasons for the exponential growth phase, the plateau phase and the transitional phase between these two phases. • The sigmoid graph showing the population growth of a species has three phases: • the exponential phase • the transitional phase • the plateau phase
5.3.3 Explain the reasons for the exponential growth phase, the plateau phase and the transitional phase between these two phases. • At the start of the sigmoid curve we can see the exponential phase. • This is where there is a rapid increase in population growth as natality rate exceeds mortality rate. • The reason for this is because there are abundant resources available such as food for all members of the population and diseases and predators are rare.
5.3.3 Explain the reasons for the exponential growth phase, the plateau phase and the transitional phase between these two phases. • As time passes, the population reaches the transitional phase. • This is where the natality rate starts to fall and/or the mortality rate starts to rise. • It is the result of a decrease in the abundance of resources, and an increase in the number of predators and diseases. • However, even though population growth has decreased compared to the exponential phase, it is still increasing as natality rate exceeds mortality rate.
5.3.3 Explain the reasons for the exponential growth phase, the plateau phase and the transitional phase between these two phases. • Finally, the population reaches the plateau phase. Here, the population size is constant so no more growth is occurring. • This is the result of natality rate being equal to mortality rate and is caused by resources becoming scarce and an increase in predators, diseases and parasites. • These are the limiting factors to the population growth.
5.3.3 Explain the reasons for the exponential growth phase, the plateau phase and the transitional phase between these two phases. • If natality rate starts to drop then mortality rate will drop too as more resources become available. • As natality rate starts to increase again so does mortality rate as resources become scarce.
5.3.3 Explain the reasons for the exponential growth phase, the plateau phase and the transitional phase between these two phases. • This keeps the population number relatively stable. • If a population is limited by a shortage of resources then we say that it has reached the carrying capacity of the environment.
5.3.3 Explain the reasons for the exponential growth phase, the plateau phase and the transitional phase between these two phases.
5.3.3 Explain the reasons for the exponential growth phase, the plateau phase and the transitional phase between these two phases.
5.3.4 List three factors that set limits to population increase. • With unlimited resources the population would increase exponentially. • In reality however environmental resistance limits the population growth and determines the carrying capacity of the habitat: • shortage of food or prey • predation or parasitism • disease • accumulation of waste • shortage of space or territory
Citations • http://www.ibguides.com/biology/notes/populations • http://photography.nationalgeographic.com/photography/ • http://www.huffingtonpost.com/2009/09/30/fall-migration-animal-mig_n_303108.html • http://click4biology.info/c4b/5/eco5.3.htm • http://ngm.nationalgeographic.com/ngm/photo-contest/2012/entries/200431/view/ • http://www.ypte.org.uk/environmental/migration-why-do-animals-migrate-/106 • http://www.nsis.org/gallery/pl-daisy.html • http://lib.jiangnan.edu.cn/ASM/116-6.jpg • http://www.marietta.edu/~biol/biomes/succession.htm • http://wps.aw.com/bc_campbell_biology_7/26/6672/1708062.cw/index.html • http://www.biotopics.co.uk/newgcse/pics/kingpenguincolony.jpg • http://www.biotopics.co.uk/newgcse/pics/200410815336186zebra%20and%20oryx.jpg • http://www.biotopics.co.uk/newgcse/pics/Tfern2.jpg • http://www.topfoto.co.uk/gallery/darwin/ppages/ppage6.html • http://www.ehow.com/facts_7260360_animal-behavior-restriction-carrying-capacity.html