Download
1 / 35
370 likes | 760 Views
Nonlinear Dimensionality Reduction for Hyperspectral Image Classification . Tim Doster Advisors: John Benedetto & Wojciech Czaja. Outline. Introduction Dimensionality Reduction Algorithms Implementation Challenges Validation Next Semester. High Dimensional Data.

E N D
Nonlinear Dimensionality Reduction for Hyperspectral Image Classification Tim Doster Advisors: John Benedetto & WojciechCzaja
Outline • Introduction • Dimensionality Reduction • Algorithms • Implementation • Challenges • Validation • Next Semester
High Dimensional Data • Data that contains many readings for each object • Examples include: • Medical • Identification and Biometrics • Polling and Questionnaires • Imaging: Hyperspectral Images
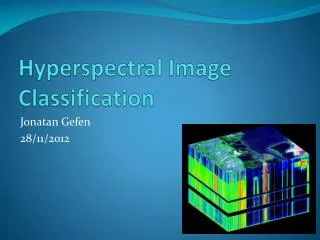
Hyperspectral Imagery • A black and white digital image contains 1 spectral band • A numerical value represents intensity • For example an integer between 0 and 255 • A color digital image contains 3 spectral bands • Red, blue and green • A Hyperspectral digital image contains hundreds of spectral bands • Visible, infrared, ultraviolet
Hyperspectral Imagery • Hyperspectral Cube • Each pixel has an associated vector of sensor readings for specific wavelengths • Typical Images are at least 1000x1000 pixels with 150 bands • 150 million data points • ~300 megabytes
Dimensionality Reduction • Due to volume of data, to make analysis, transmission, and storage easier, we seek to reduce to dimensionality of the data without sacrificing too much of the intrinsic structure of the data • We also seek to make differences between pixels more dramatic by throwing away similar information
Techniques For Dimensionality Reduction Used • Local Linear Embedding • ISOMAP
Local Linear Embedding • Step 1: Find the KNN for each point in the data set using the Euclidean metric. • Step 2: Find the linear combination (reconstruction weights), Wi, for each pixel from its KNN. • We are creating a hyperplane through each point which is invariant to rotation, translation and stretching • The Wi‘s form a matrix W called the weight matrix
Local Linear Embedding • Step 3. We minimize the cost function: to compute the lower dimensional embedding. It can be shown that this is equivalent to finding the the eigenvectors associated with the d smallest nonzero eigenvalues to: M=(I-W)T(I-W)
ISOMAP • Step 1: Find the KNN for each point in the data set using the Euclidean metric. • Step 2: Calculate, S, the pairwiseshortest geodesic distance for all data points • Step 3: Minimize the cost function, where Y is the low dimension embedding
ISOMAP • Step 3 – Alternative This minimization can be shown to be the same as finding for the eigenproblem: Note H is the centering matrix
Comparing the two • ISOMAP: preserve pairwise geodesic distance between points • LLE: preserve local properties only, e.g., relative local distances
Implementation • Initial prototyping in IDL and experimentation with Matlab DR Toolbox • LLE and ISOMAP were implemented in C++ • Programs take as input the number of nearest neighbors (k), the intrinsic dimensionality (dim), and the data (data.in) • The programs return the embedding in a .out data file • Example >>lle 3 2 data.in
Implementation • Made use of platform optimized libraries for matrix operations • Tried to use memory efficiently (still work in progress) • Calling destructor • Sparse matrices and solvers • Good cache management
Libraries Used • Boost Libraries • BLAS Level I,II,III calculations • Dot product, vector norm, matrix-vector product, matrix-matrix product, Ax=b • ARPACK • Sparse Eigenproblem solver • LAPACK • General Eigenproblem solver
Data files • Contain a header line with the number of rows, columns, and original dimensionality • When using actual images rows and columns are necessary to reform image • Values are comma separated for easy parsing in both C++ and Matlab
Program IO data.in 1,8,3 1.1,2.2,3.4 3.1,2.2,4.1 1.5,1.7,1.6 2.2,2.2,4.5 2.2,4.4,4.9 1.1,0.2,0.5 0.5,0.5,0.5 3.2,2.5,5.9 data.out 1,8,2 -0.635175,-0.244168 0.396364,0.542725 -0.112297,-0.267642 -0.180249,0.171422 -0.279562,0.191863 0.414977,-0.395243 0.379083,-0.418873 0.0168588,0.419917
Profiling bash-3.2$ ./lle 12 2 in.data 1 Data has been read in 0.000175 seconds Pairwise distance matrix found 0.000101 seconds k nearest neighbors found 8.2e-05 seconds Reconstruction Weights found 0.012554 Output written to file 0.000221 seconds Program Done Runtime: 0.014169 seconds
Possible Optimizations • Better use of sparse matrices • Memory vs Processor program paths • Is it better to store some calculations that need to be used again or calculate them again and save memory? • Can likely be arrivedatexperimentally
Initial Validation Steps • Exactly match established Matlab output for small data set (10 points, 3 dimensions)
Initial Validation Step - LLE C++ Implementation Matlab DR Toolbox -0.635175,-0.244168 0.396364,0.542725 -0.112297,-0.267642 -0.180249,0.171422 -0.279562,0.191863 0.414977,-0.395243 0.379083,-0.418873 0.0168588,0.419917
Validation • Make use of artificial data sets, used in manifold learning, which are defined in 3 dimensions but actually lie on a 2 dimensional manifold
Validation Tests • Truthworthiness, T(k): Measures the proportion of points that are too close together • We want numbers close to 1 • Continuity, C(k): Measures the proportion of points that are too far apart • We want numbers close to 1
Challenges Encountered • Using external libraries • Linking with program • different data structures • Sparsity • Matlab is really great at doing these things for you • Matching output to Matlab for large data sets • Eigensolvers all slightly different
What is next? Landmark Points • The basic idea is build the neighborhood graph with a small subset of the available points and then find the low dimensional embedding from these points. • Those points not chosen as landmarks use the embeddings of their k-nearest landmarks to define their embedding. • We sacrifice embedding accuracy for vastly improved speed and memory usage
Next Semester • January • Link C++ code with IDL/ENVI • Optimize code for memory usage • February and March • Implement landmarks and validate algorithms • April • Use algorithms with and without landmarks on hyperspectral classification images • May • Prepare final presentation • If time permits: • parallel implementation, other NLDR algorithms, automatic KNN selection
References • An Introduction to Local Linear Embedding • Saul and Roweis, 2001 • A Global Network for Non-Linear Dimension Reducation • Teneenbaum, Silvia, Langford • Out-of-Sample Extensions for LLE, Isomap,MDS, Eigenmaps, and Spectral Clustering • Bengio, Paiement and Vincent, 2003 • Exploiting Manifold Geometry in Hyperspectral Imagery • Bachmann, Ainsworth and Fusina, 2005 • Dimensionality Reduction: A Comparative Review • Maaten, Postma and Herik, 2008
Example Data SetLand Classification PROBE1 HSI Image Ground Classification
Computation Costs • For Example LLE is: • KNN: O(N log N) • Finding Weights: O(N D K3) • Solving Eigenproblem: O(dN2) • Since N is the number of pixels in the image these calculations can become daunting