Download
1 / 25
250 likes | 361 Views
Florida: An Economic Overview. February 14, 2009. More Measured Economy. Florida’s growth is now decelerating. State Gross Domestic Product (GDP) ranks us 47 th in the nation in real growth (12 th in 2006 and 2 nd in 2005). Quarterly personal income growth now negative (-0.3%, Q3).

E N D
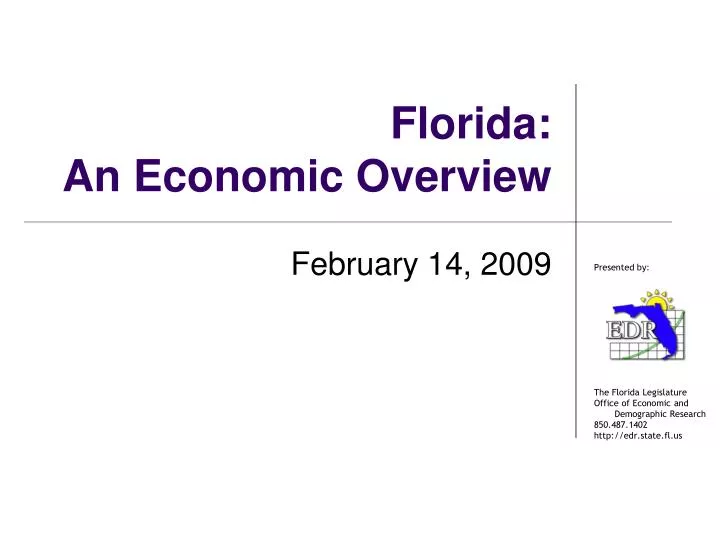
Florida:An Economic Overview February 14, 2009
More Measured Economy • Florida’s growth is now decelerating. State Gross Domestic Product (GDP) ranks us 47th in the nation in real growth (12th in 2006 and 2nd in 2005). Quarterly personal income growth now negative (-0.3%, Q3).
Employment Softens Dec (YOY) US -1.9% FL -3.2% (-255,200 jobs) December US 7.2 FL 8.1 (752,000 people) Projected FL 8.1 LateSummer 09
Population Growth Slowing • Population growth continues to be the state’s primary engine of economic growth, fueling both employment and income growth. • Population growth hovered between 2.0% and 2.6% from the mid 1990’s to 2006, then began to slow – only reaching 0.7% in 2008. Over the forecast horizon, population growth will rebound slightly – averaging 1.1% between 2025 and 2030. • Florida is on track to break the 20 million mark in 2014, becoming the third most populous state sometime before then – surpassing New York.
Florida’s April 1 Population Florida’s population: • was 15,982,824 in 2000 • was 18,680,367 in 2007 • is forecast to grow to 24,750,617 by 2030
Florida’s Population Growth Population increased by: • 402,580 between 1999 and 2000 • 445,224 between 2003 and 2004 • 331,235 between 2006 and 2007 • 126,735 between 2007 and 2008 (estimated) Population is forecast to increase on average by: • 299,846 between 2015 and 2020 • 289,630 between 2020 and 2025 • 269,585 between 2025 and 2030
Population Components • Most of Florida’s population growth is from net migration, representing about 79 percent of Florida’s population growth between 2006 and 2007. • In 2030, net migration is forecast to represent 90.9 percent of Florida’s population growth.
The Reasons? • US economy is being simultaneously buffeted by three major shocks: • Home prices have fallen at the national level for the first time since the Great Depression (down over 20% from the peak), • Financial markets are experiencing their worst credit crunch since the late 1980s at best – maybe since the Great Depression, and • The U.S. recession has spread globally, causing additional feedback loops. • Florida has been particularly hit hard by the two housing-related shocks: home prices and credit tightening.
Existing Home Prices P-t-T -39.7%
Overhang • The national inventory of homes is above 11 months. • In Florida, the excess supply of homes is likely greater than 300,000. • Subtracting the “normal” inventory and using the most recent sales experience, Florida would need significant time to work off the current excess: • January to March, 2010...Optimistic • July to September, 2010...Pessimistic
*Housing units based on 2007 U.S. Census Data Foreclosure Filings 2008... 2nd Highest # of Filings (385,309 properties) 2nd Highest Foreclosure Rate (4.52% of housing units received at least 1 filing during the year) December Highest... Lee, Osceola and St. Lucie
Vulnerability 71.8% Avg = 66.3% If the 2007 rate dropped immediately back to the long-run average, 409,418 homeowners would be affected and over $80 billion of value.
Recession – Now A Reality • United States economy has officially been in a recession since December 2007. • Already longer than the last two recessions – and projected to last two more quarters for a total of 18 months.
Sentiment is Eroding • Consumer sentiment can be a leading indicator of recession: nationally, it is near the lowest levels ever obtained (61.2 in January versus 51.7 in May 1980). Only eleven months have been lower in the history of the index, and five of those were during this recession. • Florida’s consumer confidence (January: 68) remains not too far from its record low (59) set in June.
Credit Market TED Spread Difference between 3 mo. Libor and T-bill 5 4 3 2 1 0 August 2007 Jan-07 Sep-07 May-08 Jan-09
The Economy Will Rebound By April 2010, growth rates will begin a slow return to more typical levels. In the meanwhile... • The national economic contraction will run its course and, more importantly, the financial markets will recover stability. • The subsequent turnaround in Florida housing will be led by: • Falling home prices that begin to attract buyers and clear the inventory (FL below the national average in November: $180,800 nationally vs. $158,300 in Florida...12.4% below) • Long-run sustainable demand caused by continued population growth and household formation. • Florida’s unique demographics and the aging of the baby-boom generation.
Revenue: Bringing It Together • Drags are more persistent relative to some past events, and strength will be slow to return. • Credit Market remains extremely sluggish. • Global recessionary conditions affect international migration, tourism and spending decisions, as well as exports. • U.S. Consumers will be responding to massive wealth destruction and tighter credit conditions. • Recovery in the Florida housing market is not anticipated until April 2010, at least.
Lower General Revenue Estimate Holiday season was weak. Official collections down $85.6 million since last estimate.
National Perspective New York Times Graphic – FY 2009-10 Budget Gap