Download
1 / 10
100 likes | 106 Views
Estimated patterns of trade in services flows between OECD countries and rest of the world. Agenda Item 5.i. Fabiana Cerasa OECD Statistics Directorate. 3rd WPTGS meeting 4-6 October 2010, OECD. Estimated patterns of TIS flows. 3rd WPTGS meeting 4-6 October 2010, OECD.

E N D
Estimated patterns of trade in services flows between OECD countries and rest of the world Agenda Item 5.i Fabiana Cerasa OECD Statistics Directorate 3rd WPTGS meeting 4-6 October 2010, OECD
Estimated patterns of TIS flows 3rd WPTGS meeting 4-6 October 2010, OECD
Steps to fill the matrix 3rd WPTGS meeting 4-6 October 2010, OECD
1st and 2nd steps 3rd WPTGS meeting 4-6 October 2010, OECD
3rd and 4th steps 3rd WPTGS meeting 4-6 October 2010, OECD
Guesstimates For example, after having exploited every potential information provided by mirror statistics: • half of the unallocated export from Africa have been allocated to Gulf Arabia with the other half going to Africa. • the unallocated Middle East exports have been equally divided between Africa and the Middle East • Taiwan’s estimated partner country distribution replicates the breakdown provided by Hong Kong • Thailand’s estimated partner country distribution replicates the breakdown provided by Singapore • in the 3rd and 4th steps OECD data have been used only for Hong Kong and Russian Federation
Final steps • After completion, the line totals have been scaled up to: • the total exports available in OECD International trade in services by category of services (TIS dataset) for the top side of the matrix that corresponds to OECD exporting countries • the IMF BOP totals for the bottom side that corresponds to non-OECD exporting countries • Finally, in the standard table presentation, the five continents shown (Africa, America, Asia and Oceania and Europe) have been created reallocating OECD and non-OECD country data
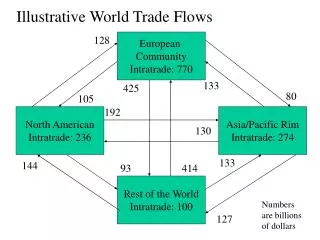
Final result OECD Asia and Oceania trades mainly with Asia and Oceania (3.3%) and America (2.1%). 4.3% of world services exports exported by OECD Asia and Oceania to OECD countries, with the largest share (1.9%) to NAFTA OECD countries accounted for 71% of world service exports intra-OECD exports accounted for 77% of total OECD exports …while an estimated 53% of OECD exports goes to OECD Europe countries 65.3% of OECD Europe’s exports destined for other OECD Europe countries 2.6% of world services exports to Africa, while 1.3% exported by Africa to Europe 3rd WPTGS meeting 4-6 October 2010, OECD
Coverage of data reported directly and supplementary mirror data 3rd WPTGS meeting 4-6 October 2010, OECD
Questions to WPTGS delegates: • Are you aware of any other existing trade in services world matrix? • Are you aware of any other possible database from which bilateral data can be sourced? • Any suggestions to improve the methodology? 3rd WPTGS meeting 4-6 October 2010, OECD