Download
1 / 11
110 likes | 241 Views
Fractal behavior of the BCC / FCC phase separation in iron-gold alloys Artur Błachowski 1 , Krzysztof Ruebenbauer 1 , Anna Rakowska 2,3 1 Mössbauer Spectroscopy Division, Institute of Physics, Pedagogical University, Kraków , Poland 2 Faculty of Materials Science and Ceramics,

E N D
Fractal behavior of the BCC/FCC phase separation in iron-gold alloys Artur Błachowski 1, Krzysztof Ruebenbauer 1, Anna Rakowska 2,3 1Mössbauer Spectroscopy Division, Institute of Physics, Pedagogical University, Kraków, Poland 2Faculty of Materials Science and Ceramics, AGH University of Science and Technology, Kraków, Poland 3Institute of Metallurgy and Materials Science, Polish Academy of Science, Kraków, Poland
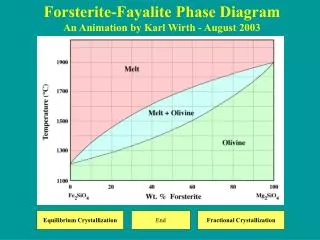
Fe70Au30andFe50Au50 as-castandannealed 250ºC/24h + 500ºC/48h Fe-Au Phase Diagram BCC–Fe(Au) as-cast 3 at.% Au annealed~0 at.% Au FCC–Au(Fe) as-cast 33 at.% Fe annealed 23 at.% Fe Nanoparticles of FCC-Au(Fe) and BCC-Fe(Au) phases with diameter about 50nm!!! Ultra high-resolution scanning electron microscope SEM-FEG + EDS (Nova 200 NanoSEM) 200x – 300000x
Fe70Au30 as-cast EDS results (1 μmscale) 14 at.% Au in dark regionsand45 at.% Au in bright regions
Fe50Au50 as-cast EDS results (1 μmscale) 49 -56at.% Au
Fe70Au30 annealed EDS results (1 μmscale) 14 at.% Au in dark regionsand45 at.% Au in bright regions
Fe50Au50 annealed EDS results (1 μmscale) 19 at.% Au in dark regionsand75 at.% Au in bright regions
What is fractal? – self-similarity – fractaldimension 1) mathematical fractal Sierpiński carpet and triangle, Mandelbrot set, Julia set,Barnsley’s fern (atractor) 2) natural fractal mountain landscape, window frost, cauliflower surface, blood vessels, exchange quotations
Roughness method Imagewere pixelized into square pixels with L= 8 bits per pixel representing linear gray scale with the highest value (255) representing “white”. N= 2048 pixels vertical and M= 2375 pixels horizontal. logR log r r - pixel edge size fractal dimension
Test d=1.903(4) d=1.8928
Results diffusion limited aggregation (DLA) fractal d= 1.71
Conclusions – self-similarity 500 μm 500 nm – fractal dimension similar to (hydrodynamic) DLA fractal