Download
1 / 1
10 likes | 191 Views
Trabecular Thickness (mm). WT. A/A. G/G. Trabecular Separation (mm). Trabecular Number (per mm). WT. A/A. G/G. WT. A/A. G/G. Ultimate Force. Stiffness. *. WT. G/G. WT. A/+. A/A. WT. G/+. G/G. WT. A/+. A/A. WT. G/+. G/G. Energy to Failure. Energy to Ultimate Force.

E N D
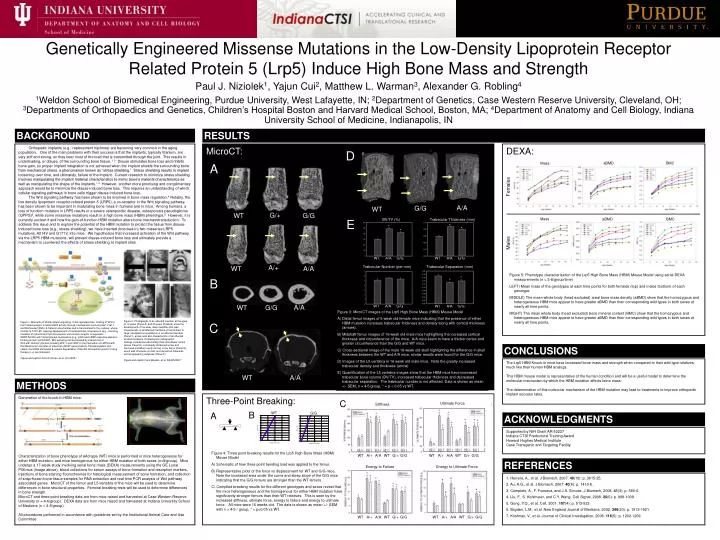
Trabecular Thickness (mm) WT A/A G/G Trabecular Separation (mm) Trabecular Number (per mm) WT A/A G/G WT A/A G/G Ultimate Force Stiffness * WT G/G WT A/+ A/A WT G/+ G/G WT A/+ A/A WT G/+ G/G Energy to Failure Energy to Ultimate Force * * * * WT A/+ A/A WT G/+ G/G WT A/+ A/A WT G/+ G/G Genetically Engineered Missense Mutations in the Low-Density Lipoprotein Receptor Related Protein 5 (Lrp5) Induce High Bone Mass and Strength Paul J. Niziolek1, Yajun Cui2, Matthew L. Warman3, Alexander G. Robling4 1Weldon School of Biomedical Engineering, Purdue University, West Lafayette, IN; 2Department of Genetics, Case Western Reserve University, Cleveland, OH; 3Departments of Orthopaedics and Genetics, Children’s Hospital Boston and Harvard Medical School, Boston, MA; 4Department of Anatomy and Cell Biology, Indiana University School of Medicine, Indianapolis, IN BACKGROUND RESULTS Orthopedic implants (e.g., replacement hip/knee) are becoming very common in the aging population. One of the main problems with their success is that the implants, typically titanium, are very stiff and strong, so they bear most of the load that is transmitted through the joint. This results in underloading, or disuse, of the surrounding bone tissue. 1-3 Disuse stimulates bone loss and inhibits bone gain, so proper implant integration is not achieved when the implant shields the surrounding bone from mechanical stress, a phenomenon known as “stress shielding.” Stress shielding results in implant loosening over time, and ultimately, failure of the implant. Current research to minimize stress shielding involves manipulating the implant material characteristics to mimic bone’s material characteristics as well as manipulating the shape of the implants.1-3 However, another more promising and complimentary approach would be to minimize the disuse-induced bone loss. This requires an understanding of which cellular signaling pathways in bone cells trigger disuse-induced bone loss. The Wnt signaling pathway has been shown to be involved in bone mass regulation.4 Notably, the low density lipoprotein receptor-related protein-5 (LRP5), a co-receptor in the Wnt signaling pathway, has been shown to be important in modulating bone mass in humans and in mice. Among humans, a loss of function mutation in LRP5 results in a severe osteoporotic disease, osteoporosis pseudoglioma (OPPG)5, while some missense mutations result in a high bone mass (HBM) phenotype.6 However, it is currently unclear if and how the gain-of-function HBM mutation alters bone mechanotransduction. To address this issue and to explore the potential of the HBM mutation to protect the tissue from disuse-induced bone loss (e.g., stress-shielding), we have inserted (knocked-in) two missense LRP5 mutations, A214V and G171V, into mice. We hypothesize that increased activation of the Wnt pathway, via the LRP5 HBM mutations, will prevent disuse-induced bone loss and ultimately provide a mechanism to counteract the effects of stress shielding at implant sites. MicroCT: DEXA: D aBMD BMC Mass A Females A/A G/G WT G/+ WT G/G Mass BMC aBMD E BV/TV (%) * * * * Males WT A/A G/G A/+ WT A/A Figure 5: Phenotype characterization of the Lrp5 High Bone Mass (HBM) Mouse Model using serial DEXA measurements (n = 3-8/group/time) LEFT) Mean mass of the genotypes at each time points for both females (top) and males (bottom) of each genotype. MIDDLE) The mean whole body (head excluded) areal bone mass density (aBMD) show that the homozygous and heterogeneous HBM mice appear to have greater aBMD than their corresponding wild types in both sexes at nearly all time points. RIGHT) The mean whole body (head excluded) bone mineral content (BMC) show that the homozygous and heterogeneous HBM mice appear to have greater aBMD than their corresponding wild types in both sexes at nearly all time points. * B * A/A G/G WT Figure 3: MicroCT images of the Lrp5 High Bone Mass (HBM) Mouse Model A) Distal femur images of 6 week old female mice indicating that the presence of either HBM mutation increases trabecular thickness and density along with cortical thickness (arrows). B) Midshaft femur images of 16 week old male mice highlighting the increased cortical thickness and circumference of the mice. A/A mice seem to have a thicker cortex and greater circumference than the G/G and WT mice. C) Cross-sectional image of the male 16-week old skull highlighting the difference in skull thickness between the WT and A/A mice, similar results were found for the G/G mice. D) Images of the L5 vertebra in 16 week old male mice. Note the greatly increased trabecular density and thickness (arrow) E) Quantification of the L5 vertebra images show that the HBM mice have increased trabecular bone volume (BV/TV), increased trabecular thickness and decreased trabecular separation. The trabecular number is not affected. Data is shown as mean +/- SEM, n = 4-5/group, * = p < 0.05 vs WT. Figure 2: Photographs of an affected member at the ages of 12 years (Panel A) and 45 years (Panel B) show the development of the wide, deep mandible that was characteristic of all affected members of the kindred. A large, lobulated torus palatinus in an affected member (Panel C, arrow) was also characteristic of all affected kindred members. Characteristic radiographic findings included an abnormally thick mandibular ramus (arrow, Panel D); a markedly thickened cortex and narrowed medullary cavity (arrow) in the femur (Panel E), which was otherwise normal; and dense but otherwise normal-appearing vertebrae (Panel F). Figure and caption from Boyden, et al. NEJM 2002.6 Figure 1: Elements of Wnt/β-catenin signaling. In the liganded state, binding of Wnt to the frizzled receptor inhibits GSK3 activity through mechanisms involving Axin, Frat-1, and Disheveled (Dsh). β-Catenin accumulates and is translocated to the nucleus, where it binds to TCF/LEF, causing displacement of transcriptional corepressors (e.g., silencing mediator of retinoid and thyroid receptors and nuclear receptor corepressor; SMRT/NCoR) with transcriptional coactivators (e.g., p300 and cAMP response element–binding protein; p300/CBP). Wnt signaling can be blocked by interactions of Wnt with inhibitory factors including WIF-1 and sFRP or the interaction of LRP5/6 with the Dkk/Kremen complex or sclerostin (SOST gene product). Phosphorylation of β-catenin by GSK3 stimulates β-catenin degradation. Potential intervention points for drug therapy (i–v) are indicated. Figure and caption from Krishnan, et al. JCI 2008.7 C CONCLUSIONS The Lrp5 HBM Knock-in mice have increased bone mass and strength when compared to their wild type relatives, much like their human HBM analogs. This HBM mouse model is representative of the human condition and will be a useful model to determine the molecular mechanism by which the HBM mutation affects bone mass. The determination of this molecular mechanism of the HBM mutation may lead to treatments to improve orthopedic implant success rates. A/A WT METHODS Generation of the knock-in HBM mice: Characterization of bone phenotype of wild-type (WT) mice is performed in mice heterogeneous for either HBM mutation, and mice homogenous for either HBM mutation of both sexes (n=8/group). Mice undergo a 17-week study involving serial bone mass (DEXA) measurements using the GE Lunar PIXImus (image above), blood collections for serum assays of bone formation and resorption markers, injections of bone staining fluorochromes for histological measurement of bone formation, and collection of snap-frozen bone tissue samples for RNA extraction and real time PCR analysis of Wnt pathway associated genes. MicroCT of the femur and L5 vertebra of the mice will be used to determine differences in bone structural properties. Femoral breaking tests will be used to determine differences in bone strength. MicroCT and three-point breaking data are from mice raised and harvested at Case Western Reserve University (n = 4-6/group). DEXA data are from mice raised and harvested at Indiana University School of Medicine (n = 3-8/group). All procedures performed in accordance with guidelines set by the Institutional Animal Care and Use Committee Three-Point Breaking: C B A ACKNOWLEDGMENTS Supported by NIH Grant AR-53237 Indiana CTSI Predoctoral Training Award Howard Hughes Medical Institute Case Transgenic and Targeting Facility Figure 4: Three point breaking results for the Lrp5 High Bone Mass (HBM) Mouse Model A) Schematic of how three-point bending load was applied to the femur. B) Representative plots of the force vs displacement for WT and G/G mice. Note the increased area under the curve and steep slope of the G/G mice indicating that the G/G femurs are stronger than the WT femurs. C) Compiled breaking results for the different genotypes and sexes reveal that the mice heterogeneous and the homogenous for either HBM mutation have significantly stronger femurs than their WT relatives. This is seen by the increased stiffness, ultimate force, energy to failure and energy to ultimate force . All mice were 16 weeks old. The data is shown as mean +/- SEM with n = 4-5 / group, * = p<0.05 vs WT. REFERENCES 1. Herrera, A., et al. J Biomech, 2007. 40(16): p. 3615-25. 2. Au, A.G., et al. J Biomech, 2007. 40(6): p. 1410-6. 3. Completo, A., F. Fonseca, and J.A. Simoes. J Biomech, 2008. 41(3): p. 560-6. 4. Liu, F., S. Kohlmeier, and C.Y. Wang. Cell Signal, 2008. 20(6): p. 999-1009. 5. Gong, Y.Q., et al. Cell, 2001. 107(4): p. 513-523. 6. Boyden, L.M., et al. New England Journal of Medicine, 2002. 346(20): p. 1513-1521. 7. Krishnan, V., et al. Journal of Clinical Investigation, 2006. 116(5): p. 1202-1209.