Download
1 / 7
70 likes | 197 Views
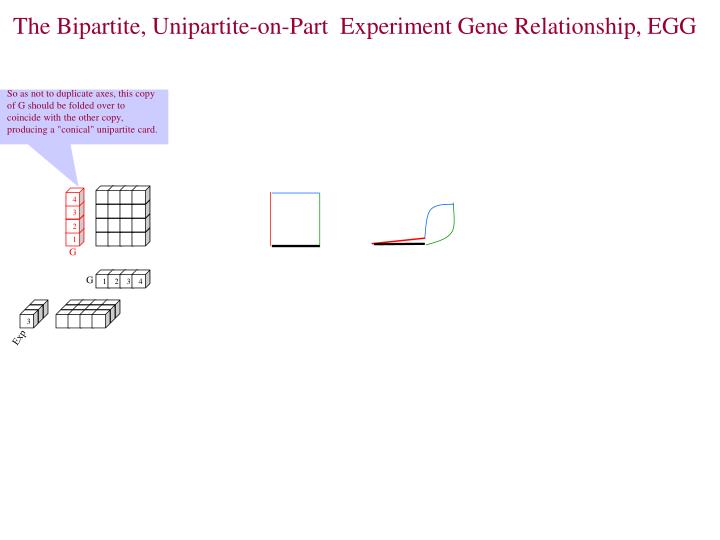
The Bipartite, Unipartite-on-Part Experiment Gene Relationship, EGG. So as not to duplicate axes, this copy of G should be folded over to coincide with the other copy, producing a "conical" unipartite card. 4. 3. 2. 1. G. G. 1. 2. 3. 4. 1. 1. 3. Exp. 16. 6. itemset itemset card.

E N D
The Bipartite, Unipartite-on-Part Experiment Gene Relationship, EGG So as not to duplicate axes, this copy of G should be folded over to coincide with the other copy, producing a "conical" unipartite card. 4 3 2 1 G G 1 2 3 4 1 1 3 Exp
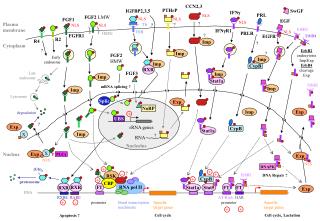
16 6 itemset itemset card 5 Item 4 3 2 1 Author People 1 1 2 2 2 3 3 4 3 4 4 5 5 6 7 ItemSet ItemSet antecedent Customer 1 1 1 1 1 1 1 1 5 6 16 1 1 1 1 1 1 1 1 1 Doc 1 2 3 term G 1 2 3 4 5 6 7 Doc 4 3 2 1 PI Gene 3 4 t 5 1 6 1 2 1 3 Gene 3 Exp 4 5 6 7 Conf(AB) =Supp(AB)/Supp(A) Supp(A) = CusFreq(ItemSet) DataDex Model cust item card termdoc card authordoc card genegene card (ppi) docdoc card (hyperlink anal.) People Each axis, a, inherits a frequency attribute from each of its cards, c(a,b), denoted bf(c.a) "# of bs related to a" (e.g., df(t) = doc freq of term, t). Of course, bf(c.a) is inherited redundantly by c(a,b). Each card, c(a,b), inherits a frequency attribute from each of its axes, a [b], denoted af(a,b)"# times a is related to b in c" [bf(a,b)"# times b~a in c"] Each card, c(a,b), can be expanded by each of its axes, e.g., a, to a-sets (each a value is identified with the singleton, {a}) (e.g., itemsets in MBR) or a-sets can become a new axis (e.g., doc in IR. Note, if term is expanded by singleton termsets to be part of doc, then the termdoc card becomes a cone (see first slide)). Next we put some of the descriptive attributse in their places. Note: Conf / non-conf rules partition itemset-itemset card. Can we usefully list confident rules by specifying the boundary (SVM style)? That presuppose spatial continuity of conf rules (may not be correct assumption) but it may be on another similar card? expPI card expgene card genegene card (ppi) termterm card (share stem?)
expPI card 1 1 1 3 1 Exp 1 1 1 1 1 1 3 1 3 DataDex Model combining term doc and item itemset (no animation) 16 6 Item itemset itemset card 5 cust itemset card 4 3 2 PI 1 People Author Customer 1 2 3 4 5 6 7 ItemSet 1 2 3 4 5 6 16 4 ItemSet (antecedent) genegene card (ppi) 1 1 1 1 3 termdoc author doc 1 1 1 1 2 termterm 1 Gene doctermgene ItemSet can be replaced by ItemBag (allowing duplicates and promoting count analysis). 8 9 512 1 2 3 4 5 6 7 expgene card
∞ 6 Item 5 5 6 ∞ DataDex uncombining term-doc and item-itemset (using itembag (basket) so item count in a basket is defined. itembag itembag card 4 cust itembag card 3 2 1 Author People 1 2 3 4 5 6 7 ItemBag Customer 1 2 3 4 1 1 1 1 1 ItemBag termdoc card authordoc card 1 1 1 1 1 1 Doc 4 genegene card (ppi) 3 1 What is term frequency? doc frequency? 1. TD is a bag-edged graph, i.e., Edge(TD) is a bag, meaning an edge can occur multiple times (the same term "can occur in" a doc many times). If we don't distinguish those occurrences other than existence (could distinguish them into type classes, e.g., verb, noun... ) then TD can be realized as a set-edged graph with a count label, otherwise we must use a bag-edged graph with a type label. Usually, TD is the former and the count label is term frequency. Document frequency is a Term node label which is is the node degree (# of docs to which it relates). A market basket is also a bag-edged graph which is realized as a set-edged graph with a count label. 1 2 1 1 docdoc card 1 1 1 1 Gene People 2 3 term G 1 2 3 4 5 6 7 PI 2 3 4 5 Doc 1 expPI card expgene card 1 3 Exp 3 genegene card (ppi) 4 5 6 t Gene 1 2 3 termterm card (share stem?) 4 5 6 7
Author 1 2 1 2 3 2 4 3 3 4 4 5 1 1 1 1 1 1 1 1 5 6 16 1 1 1 1 1 1 1 2 3 1 2 3 exp loc card 4 5 6 7 90 . 0 . . 360 : Lon axis -90 DataDex Model People 5 6 7 Customer 1 termdoc card authdoc card 1 1 Gene 16 Doc 6 genegene card 5 6 Item itemset itemset card 4 5 cust itemset card docdoc card 3 4 3 2 People PI 1 term G 1 2 3 4 5 6 7 Doc ItemSet 1 expPI card expgene card 1 3 termterm card Exp Loc axis / card Lat axis RSI card
Author 2 1 1 3 2 2 3 3 4 4 4 5 1 1 1 1 1 1 1 1 5 6 ∞ 1 1 1 1 1 1 1 2 3 1 2 3 4 5 6 7 1 1 1 DataDex Model People 5 6 7 Customer 1 termdoc card authdoc card 1 1 Gene ∞ Doc 6 genegene card 5 6 Item itembagitembag card 4 5 cust itembag card docdoc card 3 4 3 2 People PI 1 term G 1 2 3 4 5 6 7 Doc ItemBag 1 expgene card expPI 1 3 Exp termterm card exp loc card Grnd Image card (loc=camera loc) Loc (Lat-Lon) RSI card 6 5 4 Grnd Video card 3 RSI video 2 1 Time Aperture angle axis