Download
1 / 31
310 likes | 318 Views
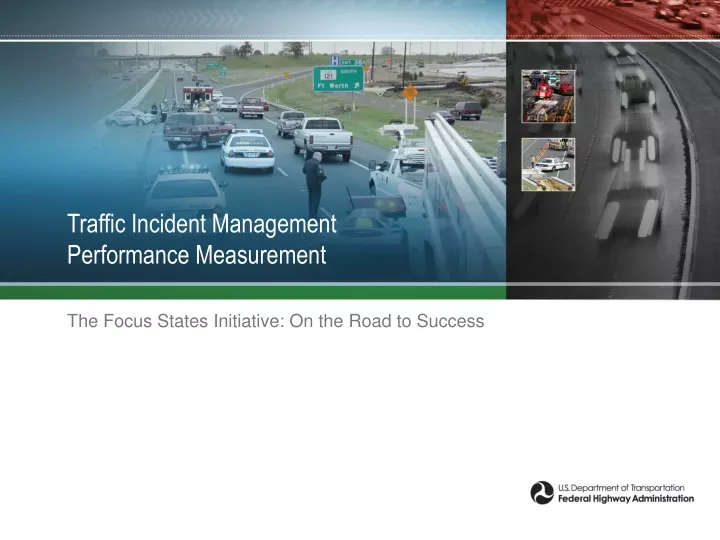
Traffic Incident Management Performance Measurement. The Focus States Initiative: On the Road to Success. Traffic Incident Management.

E N D
Traffic Incident ManagementPerformance Measurement The Focus States Initiative: On the Road to Success
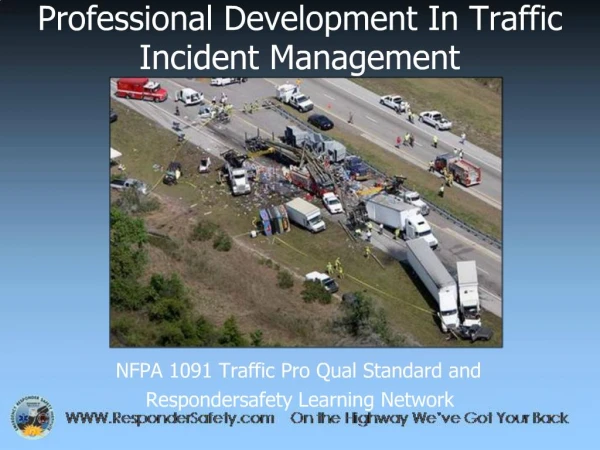
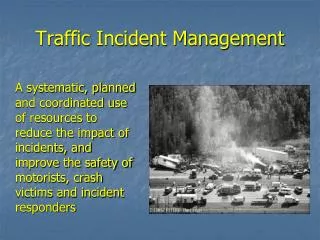
Traffic Incident Management “The systematic, planned and coordinated used of human, institutional, mechanical and technical resources to reduce the duration and impact of incidents and improve the safety of motorists, crash victims and incident responders.” Source: FHWA Traffic Incident Management (TIM) Handbook (2000).
Who are the TIM Stakeholders? • Law Enforcement • Fire and Rescue • Emergency Medical Services • Transportation Agencies • Towing and Recovery • Emergency Managers • Hazardous Materials Responders • Medical Examiners and/or Coroners • Elected and Appointed Officials • Traffic Media • Highway Users
5 Benefits of Effective TIM • Increased driver and responder safety a. Reduced secondary accidents, fatalities, injuries and property damage • Congestion relief • More effective preparation for larger-scale emergencies/disasters • Public resources go further/Happier public • Reduced emissions
Measuring Success What Gets Measured Gets Performed... • Quantifying TIM benefits will advance program continuity • Builds critical mass for program support from managers and elected officials • Supporting what works • Ensures buy-in from diverse stakeholders • Multiple agencies, coordinated response • Supports allocation of technical and budget resources
Eleven states working together to develop consensus on national program-level TIM Performance Measures Representatives from Law Enforcement and Transportation TIM Performance Measures Focus States: California Connecticut Florida Georgia Maryland New York North Carolina Texas Utah Washington Wisconsin TIM Performance Measurement Focus States Initiative
TIM Performance Measurement Focus States Initiative • Two performance measures initially identified for collection and analysis • “Roadway” Clearance Time • “Incident” Clearance Time • Third performance measure proposed by participating states • Reduce secondary crashes Focus State Testimonials: “The [TIM FSI] process helped to crystallize what the measurements are about. It became very clear we are all defining things in different ways.” New York FSI Participant “There were a lot of definitional differences between public safety and DOT. This was a major hurdle [we] overcame.” Washington FSI Participant “Determining secondary crashes and the reduction of this through TIM is important for funding for Road Rangers and the expansion of TIM.” Florida FSI Participant
TIM Performance Measurement “Roadway” Clearance Time • The time between first recordable awareness of an incident (detection/notification/verification) by a responsible agency and first confirmation that all lanes are available for traffic flow.
TIM Performance Measurement “Incident” Clearance Time • The time between the first recordable awareness and the time at which the last responder has left the scene.
TIM Performance Measurement Secondary Crashes • The number of secondary crashes beginning with the time of detection of the primary incident where a collision occurs either a) within the incident scene or b) within the queue, including the opposite direction, resulting from the original incident.
Some Focus State Experiences – Benefits of Performance Measurement
The Maryland (CHART) Experience • Response Time Reduction • Clearance Time Reduction • Delay Reduction • Reduction In Incident Duration • Fuel Consumption • Emissions • Secondary Incidents • Risks At Primary Incident Sites • Potential Incidents Due To Chart Ops.
The Wisconsin Experience • Establish a baseline • Method to monitor and improve day-to-day operations • Tool for prioritizing needs • Ultimately use to support/justify programs
Total Incidents Response Time Incident Clearance Times Travel Rate Index Hours of Delay VMS Usage Report Maintenance AverageService Time Freeway Service & SafetyPatrol Assists HOV Ramp Lane Usage Monthly Performance Report
Some Focus State Experiences – Data Collection and Evaluation
Wisconsin: Average Incident Clearance Time Definition: • Time between State Transportation Operations Center awareness of an incident and the time all vehicles/debris/etc. are clear of the incident scene (including shoulder/median) Data Source: • Start time • CAD data sent from Milwaukee County Sheriff’s Office • Operator entered: observes or is notified of an incident • End time • Operator entered: observes or is notified incident scene is clear Computation: • Automated using Incident Management System database Issues/Limitations: • Based on Operator entered data, not always highest priority Future Enhancements: • Direct link to the Wisconsin State Patrol CAD data
Florida: Incident Duration • Objective: To obtain the incident timeline from the time any Florida DOT (FDOT) or Florida Highway Patrol (FHP) staff is notified to the time that all travel lanes are cleared • “Incident Influence Time” Entire length of the timeline (from occurrence to return to normal flow) • [Roadway] Clearance Time • Begins with the arrival of the first responder, either FHP or FDOT, and ends when all mainline travel lanes are cleared • Directly comparable with the Open Roads Policy of clearing all travel lanes in 90 minutes or less
Florida: Incident Duration Data Collection • Pilot Effort in 2005 to collect incident timeline data from manual(paper) records • Results determined that collecting incident timeline data was too complex and time-consuming to be done manually • In 2006 the SunGuide statewide Traffic Management Center (TMC) software was modified to include the data collection and reporting requirements for obtaining incident duration data • 2 districts are currently able to collect data. • In late 2007 or early 2008 it is anticipated that several other Districts will also be able collect and report incident duration data
Florida: Data Collection Recommendations • Manual data collection not recommended • Too expensive, not enough data • Develop automated data collection of ALL incident timeline components through SunGuide software in all Districts • Collect data and establish targets for all components of timeline (i.e. 90 minute clearance time) in 2007
Maryland (CHART) Evaluation Findings • Reduction in Incident Duration (“Roadway” Clearance Time) for Each Incident Evaluation Period • < ½ Hour (13% Reduction) • ≥ ½ Hour & < 1 Hour (13% Reduction) • ≥ 1 Hour & < 2 Hours (41% Reduction) • ≥ 2 Hours (35% Reduction)
Some Focus State Experiences – Challenges and Lessons Learned
Florida – Challenges • Creating and maintaining a data archive that stores all the needed data (output and outcome) • Developing TMC management software that collects the needed data for the incident duration timeline (all components need to be collected and stored) manual data collection is far too time consuming • Training TMC operators to properly collect the needed incident data - they must understand the importance • Training service patrol operators to collect or at least cooperate with the TMC operators collecting incident data • Integrating disparate systems to enable data exchange • Inconsistencies in data availability
Florida – Lessons Learned • PMs need to reflect multi-agency nature of incident management • Need for output and outcome measures • Limit reporting to a critical few • Track data before setting targets
Wisconsin – Challenges • Data quality • Constant technology changes/advances • Initial lack of standard measures • Making the results meaningful to multiple audiences
CHART TIM EvaluationLessons Learned • Need Consistency In Logging “All Lanes Open” and “Incident Closed” as Separate Events • Need to Provide Select Responding Agencies with Chart Workstation Access to Log “First Recordable Awareness” Data • Evaluation Constrained Due to Lack of Data From CHART Roads • Need Ongoing/Active Participation Among TIM Stakeholders In Jurisdictions
What Is Needed to Get Started? • High-level support within your organization for tracking and evaluating TIM performance measures • Shared commitment among your TIM partners • Common language around the performance measures for clarity • And maybe: • System modifications to capture and exchange data between agencies • Develop common data elements • Real-time exchange of information • Changes in operational practices to improve TIM • Investment of additional resources in terms of people and/or equipment
Resources Available: TIM Performance Measurement Knowledge Management System • Subscribe to the TIM PM managed email list to access the experiences and expertise of the focus states and others across the country measuring TIM performance: • Ask specific questions, get helpful answers from people with experience • Suggest/share helpful resources • Send an email to TIMPM@dot.gov to subscribe! • Bookmark the TIM PM Knowledgebase at www.ops.fhwa.dot.gov/eto_tim_pse/preparedness/tim/knowledgebase/knowledgebase.htm to access documented knowledge: • TIM Performance Measurement Fact Sheet and Presentation • TIM Performance Measurement Focus State Workshop Reports • Helpful Materials/Resources from States doing performance measurement • Example Memorandum of Agreements • Example requirements documents or reports • Example systems specifications for data sharing • Contact List of TIM PM Focus States Participants • FHWA TIM Self-Assessment and other resources
Questions? • Contact the FHWA TIM Program Manager: • tel: 202-366-8042 • ETO@dot.gov • Kimberly Vásconez, FHWA ETO Team Leader: • tel: 202-366-1559 • Kimberly.Vasconez@dot.gov