Download
1 / 16
160 likes | 356 Views
Future trends in NO 2 concentrations – implications for LAQM and planning applications. Stephen Moorcroft Air Quality Consultants Ltd. Background.

E N D
Future trends in NO2 concentrations – implications for LAQM and planning applications Stephen Moorcroft Air Quality Consultants Ltd
Background • Previous presentations have highlighted the disparity between what the emissions forecasts tell us should have been happening and what the measured concentrations of both NOx and NO2 show • For almost all site types and locations, concentrations of both NOx and NO2 have been approximately constant for the past 6 to 8 years • Within Inner London, there is evidence of slight upward trend in NOx, and stronger upward trend in NO2
Background • Questions have been put to the R&A Helpdesk by several local authorities on the implications of this in carrying out Review and Assessments • “Measured NOx and NO2 concentrations in my local authority area do not appear to be declining in line with national forecasts. How should I treat NOx and NO2 concentrations in future years when completing my Review and Assessment work?”
Background • LAQM.TG(09) sets out recommended approaches for local authorities carrying out their LAQM duties • Makes reference to • 1x1 km background maps up to 2020; these are also used as the basis for adjusting measured concentrations to a future year • Emissions Factor Toolkit (revised to include new DfT emissions factors) • Approaches to project forwards monitoring data at roadside sites • There is nothing “wrong” with TG(09) – the various tools and recommended approaches are founded on the most up-to-date UK projections • Are those projections correct?
Big Questions • We know historically that the projections for declining NO2 concentrations have been wrong over the past 6-8years • Are the future year projections from 2010 correct? • If they are wrong • How long are they wrong for? • By how much are they wrong? • We don’t really know! • What advice do we give the local authorities?
Other Issues • LAQM.TG(09) has been prepared on behalf of Defra and the devolved administrations to provide guidance to local authorities in carrying out their LAQM duties • It is not “officially” intended to do anything else • In the absence of any other guidance, TG(09) approaches are often used by practitioners engaged in other areas of work • By developers (or their consultants) in carrying out air quality assessments for new schemes • By planning authorities in evaluating the impact of schemes • Revised LAQMguidance issued by Defra and devolved administrations on future projections has likely implications for other users
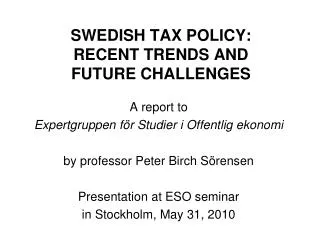
Current Projections Example: • Assume roadside NO2 concentration of 45mg/m3 in 2009 • Background NO2 is 35 mg/m3 • Based on EFTv4.2 and background maps, NO2 concentrations are predicted to decline as shown • Objective achieved by 2012 • Do we believe it??
Implications • For Review and Assessment work it potentially means that local authorities may: • Be expecting to revoke existing AQMAs • Not develop and implement Action Plans as effectively as they might • For air quality assessments, impacts are unlikely to be identified post 2012-2015, and certainly not beyond that • Potentially we are introducing new exposure into areas of poor air quality where it has not been predicted • Potentially we are adding to a future problem that has not been correctly identified
Options • For LAQM Review and Assessment work it is relatively simple: • Issue an FAQ: Unless a local authority can provide robust evidence of a significant downward trend in concentrations within its area, then it is required to present its Review and Assessment reports based on two approaches: • Using the projected decline in concentrations as set out in TG(09) • Assuming there would be no further reduction (or a modified reduction) in the foreseeable future (e.g. next 4 or 5 years)
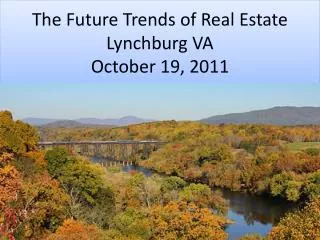
Options for Assessment of Future Roadside NO2 • 4 Scenarios considered as examples • ‘Official’ Guidance: Both road traffic emissions and background concentrations decline according to official guidance (EFT v4.2 and Background Maps) • No Reduction: Future road traffic emission factors and background concentrations stay constant at 2009 values. 1% per annum increase in traffic flow. • Background Reduction: Background concentrations reduce, but constant 2009 emission factors for road traffic. • Road Traffic Reduction: Road traffic emission factors reduce, but constant 2009 background concentration.
Options • Current understanding would suggest the actual future year concentration lies between the red and purple lines • Case to support a general reduction in the background, so maybe somewhere between the green and purple lines is more realistic
Options • For Review and Assessment it is possible to recommend that a precautionary approach be favoured for projections over the next few (4-5) years, with decisions based on a worst-case option • For air quality assessment work, such an approach is more difficult: • How do you make a planning decision with two options? • Air quality assessments can be carried out over a wide range of years (anything from 2012 to 2020+). If we assume a “flat line” approach, how long do we assume it for, and what happens after?