Download
1 / 60
600 likes | 604 Views
Helping the World’s Farmers Adapt to Climate Change. Strata Conference Oct 2012 Siraj Khaliq, CTO, The Climate Corporation. Fritchton, IN – late summer, 2012. Louisville, IL. Wichita, KA. Click to edit Master title style. 1956 2012 1988 Worst US Droughts in the Last Fifty Years.

E N D
Helping the World’s Farmers Adapt to Climate Change Strata Conference Oct 2012 Siraj Khaliq, CTO, The Climate Corporation
Click to edit Master title style 1956 2012 1988 Worst US Droughts in the Last Fifty Years • Click to edit Master text styles • Second level • Third level • Fourth level • Fifth level
Click to edit Master title style -16% 2012 Estimated Corn Yield (USDA)
Click to edit Master title style +6% World food prices month-on-month change in July 2012 (UNFAO)
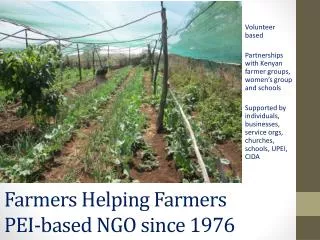
Farm Economics • Large capital outlays at start of season (April) • Seed, equipment, pesticide, and land • Revenue comes in at harvest • 1-2 years of revenue shortfall could be catastrophic • Futures help with price volatility, not weather
A real-life example Farmer Rich Vernon talks to NPR's David Schaper (audio)
Click to edit Master title style Our Mission To help all the world's people & businesses manage and adapt to climate change
Click to edit Master title style $4.2 Trillion 2012 Estimated Corn Yield (USDA)
Policy Weather Data Outcome
Structure Modeled Outcomes Weather Simulations
How does weather impact crop yield? Structure
Varies based on many inputs: • Temperature • Precipitation • Soil type • Topography • Farming practices • Crop varietal Structure
Agronomically deduced candidates • Model at large scale • Every farm in the US (20M) Structure
Structure Modeled Outcomes Weather Simulations
What weather dowe expect? Weather Simulations
1M locations (2.5mi x 2.5mi grid) 10k scenarios/location going 2 years out 2 measurements Weather Simulations 60Tb of data per simulation set every couple of weeks
2.5 x 2.5 Square Miles
Expensive computation • Parallelizing hard due to correlations • Would take 80+ years on one fast modern server-class machine • We need to generate these within days Weather Simulations
Soil Moisture Modeling What's the soil moisture at farm X?
Soil Moisture Modeling soil type, weather, topography, crop
Java frontend MySQL Pricing Server (Rserve) 2007 • 400 stations • All data in MySQL • Pricing servers (Rserve) • Java-based webapp
Java frontend MySQL Pricing Server (Rserve) Disk 2008 • 2000 stations • Weather data now on disk • Versioning hard • Java-R bridge messy
Java frontend MySQL Pricing Server (java) Simulation Service Weather data Service 2009-2010 • 22,000 locations • Rserve replaced by java • Simulations & S3/SimpleDB • Model gen in Hadoop • Moved fully to EC2 Sim gen (hadoop) SimpleDB / S3 SimpleDB / S3
Rails frontend MySQL Pricing Server (java) Marty (HBase) Geo data store S3 Sim gen (cascalog) 2011 – today • 1,000,000 locations • Own big geo-data store • Many more hadoop jobs • Eliminated SimpleDB Soil moisture dataset gen (cascalog) Other hadoop jobs Structures gen (cascalog)
MapReduce at TCC • Python (Hadoop streaming) • Some native java • Most are higher-level frameworks
Big Wins • Cascalog/Clojure • EC2 Spot Instances • “NoSQL”
Big Win #1 - Cascalog (defn weather-map-q "Creates a Cascalog query to extract individual measurement values of ObservationSet data and produces tuples of [date JSON-encoded map], in which each JSON-encoded map is keyed by station-id" [stations interval measurement sources start end nostra] (<- [?date ?json-aggregated-values] ; from hfs-textline (stations ?station-id) (fetch-obs-for-station [interval measurement sources start end nostra] ?station-id :> ?obs) (extract-values-by-date ?obs :> ?date ?value) (aggregate-values ?value :> ?aggregated-values) (json/generate-string ?aggregated-values :> ?json-aggregated-values)))
Big Win #1 - Cascalog • Easily composable workflows • Can unit test Hadoop flows • Quick iteration
Big Win #2 – EC2 Spot Instances • Good fit to our compute approach • Can be very cheap • Good availability

![United Nations Framework Convention on Climate Change [UNFCCC]](https://cdn0.slideserve.com/833451/united-nations-framework-convention-on-climate-change-unfccc-dt.jpg)