Download
1 / 12
120 likes | 125 Views
Introduction to estimation: 2 cases. Estimation is the process of using sample data to draw inferences about the population. Sample information. Population parameters. Inferences. Point and interval estimates. Point estimate – a single value the temperature tomorrow will be 2 °

E N D
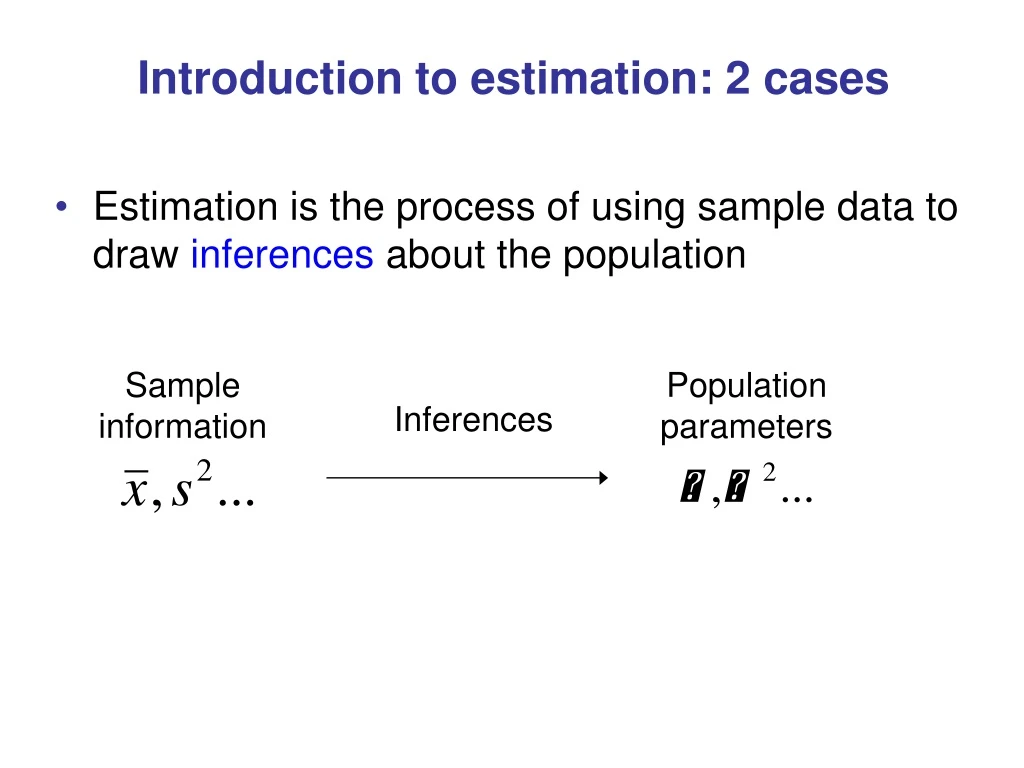
Introduction to estimation: 2 cases • Estimation is the process of using sample data to draw inferences about the population Sample information Population parameters Inferences
Point and interval estimates • Point estimate – a single value • the temperature tomorrow will be 2° • Interval estimate – a range of values, expressing the degree of uncertainty • the temperature tomorrow will be between -2° and +5°
Criteria for good estimates • Unbiased – correct on average • the expected value of the estimate is equal to the true value • Precise – small sampling variance • the estimate is close to the true value for all possible samples
Bias and precision – a possible trade-off True value
Estimating a mean (large samples) • Point estimate – use the sample mean (unbiased) • Interval estimate – sample mean ± ‘something’ • What is the something? • Go back to the distribution of
The 95% confidence interval • Hence the 95% probability interval is • Rearranging this gives the 95% confidence interval
Example: estimating average wealth • Sample data: • = 130 K • s2 = 50,000 • n = 100 • Estimate m, the population mean
Example: estimating average wealth (continued) • Point estimate: 130 (use the sample mean) • Interval estimate – use
Estimating the difference of two means • A survey found that on average women spent 3 hours per day shopping, men spent 2 hours. The sample sizes were 36 in each case and the standard deviations were 1.1 hours and 1.2 hours respectively. Estimate the true difference between men and women in shopping habits.
Same principles as before… • Obtain a point estimate from the samples • Add and subtract 1.96 standard errors to obtain the 95% CI • We just need the appropriate formulae
Calculating the point estimate • Point estimate – use • For the standard error, use • Hence the point estimate is 3 – 2 = 1 hour
Confidence interval • For the confidence interval we have • i.e. between 0.3 and 1.7 extra hours of shopping by women.