Download
1 / 64
650 likes | 848 Views
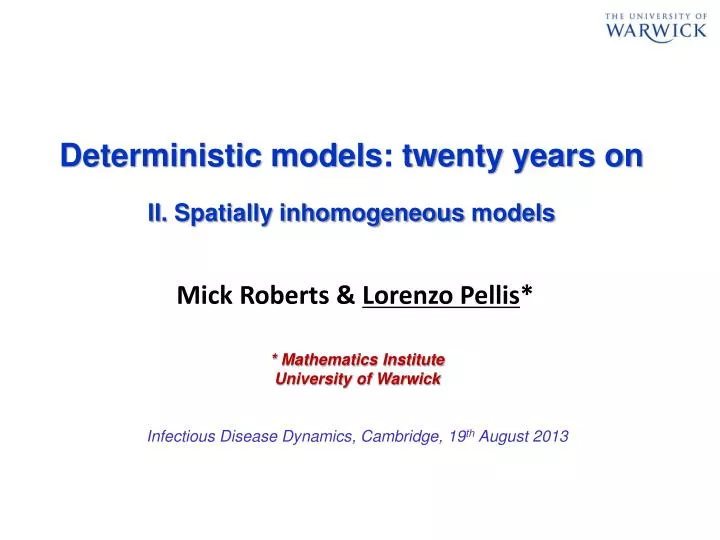
Deterministic models: twenty years on. II . Spatially inhomogeneous models. Mick Roberts & Lorenzo Pellis *. * Mathematics Institute University of Warwick Infectious Disease Dynamics, Cambridge, 1 9 th August 2013. Outline. Pair formation models Metapopulation models

E N D
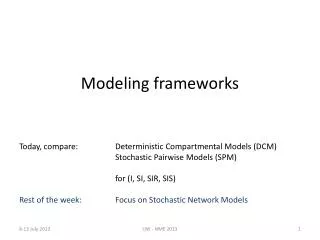
Deterministic models: twenty years on II. Spatially inhomogeneous models Mick Roberts & Lorenzo Pellis* * Mathematics Institute University of Warwick Infectious Disease Dynamics, Cambridge, 19th August 2013
Outline • Pair formation models • Metapopulation models • Spatially explicit models • Households models • Overview • Reproduction numbers • Time-related quantities • Network models • Key epidemiological quantities • (Almost) exact dynamics • Approximate dynamics • Comments
History • Introduced to better model STD transmission in partnerships • History: • First one to model pairs (in demography): Kendall (1949), “Stochastic processes and population growth” • Pair separation added: Yellin & Samuelson (1974), “A dynamical model for human populations” • For STDs: Dietz (1988), “On the transmission dynamics of HIV” Dietz & Hadeler(1988), “Epidemiological models for sexually transmitted diseases” Kretzschmar & Dietz (1988), “The effect of pair formation and variable infectivity on the spread of an infection without recovery” • Definition of for models with pairs: Diekmann, Dietz & Heesterbeek(1991), “The basic reproduction ratio for sexually transmitted diseases. Theoretical considerations” Dietz, Heesterbeek & Tudor (1993), “The basic reproduction ratio for sexually transmitted diseases. II. Effects of variable HIV-infectivity”
The basic idea Kretzschmar(2000) Kretzschmar & Dietz (1998)
Comparison with homogeneous mixing • Very fast pair dynamics lead back to homogeneous mixing • Pairs reduce the spread (and ) thanks to sequential infection: • pairs of susceptibles are protected • pairs of infectives “waste” infectivity • Comparison at constant Kretzschmar & Dietz (1998), “The effect of pair formation and variable infectivity on the spread of an infection without recovery” • Endemic equilibrium is always higher • The same can have 2 growth rates and 2 endemic equilibria, so one needs information about partnership dynamics (for both prediction and inference) • Acute HIV less important and asymptomatic stage more than expected (unless partnerships are very short)
Extensions • No concurrency: • Heterosexual (many) • With various infectious stages (many) • With heterogeneous sexual activity • With maturation period Hadeler (1993) • Two types of pairs (“steady” VS “casual”) Kretzschmaret al (1994) • With concurrency • Instantaneous infection from outside a stable partnership Watts & May (1992) • Pairwise approximation on network Ferguson & Garnett (2000); Eames & Keeling (2002) • Full network models (Monte Carlo)
Concurrency • Working definition: the mean degree of the line graph Morris & Kretzschmar(1997), “Concurrent partnerships and the spread of HIV” • Impact: always bad as it amplifies the impact of many partners • Faster forward spread (no protective sequencing) • Backwards spread • Dramatic effect on connectivity and resilience of the sexual network • Quantitative impact:
History • Born in ecology, but cross-fertilisation with epidemiology • Ideas lurking around before 1970 • First formalisation: patches can be occupied or unoccupied Levins (1969), Some demographic and genetic consequences of environmental heterogeneity for biological control • Extensions: • Patches with different sizes Hanski(many papers: 1982, 1985) • Patches with 2 internal states Gyllenberg & Hanski (1991) • Within patch dynamics Hastings & Harrison (1994) • Since the beginning, aim is to study extinction mostly stochastic
Basic model • General formulation: • It is a multitype model, but usually: • Spatial interpretation • SIS (or SIR with demography), to study oscillations, extinction and (a)synchrony • Simple case of 2 population (with coupling parameter ):
A mechanistic approach • Special case of 2 populations Keeling & Rohani(2002) • number of susceptibles with home in but who are now in • rate of leaving home • rate of coming home • Let fraction of time away from home • Then, assuming fast movements compared to disease history: • Correlation surprisingly well fit by ( estimated from data; 2 populations)
Important insights • Coupling: • no independent subpopulations • strong synchrony • weak interesting behaviour • Critical community size: • Stochastic extinction likely in small subpopulations • unlikely in large populations • Rescue effect: • Large populations keep “feeding” small populations • Asynchrony: • Can increase overall persistence
Application to measles • Simple deterministic SEIR • Good fit to data (biennial oscillations) and good CCS estimates • Add age structure and schools • Better fit to data • Make the model stochastic • Wrong CCS estimates by an order of magnitude • Possible improvements: • Metapopulation models • Cellular automata or pairwise models • More realistic latent and infectious period • Metapopulation models seems to be key to explain the pattern of measles post-vaccination era (much lower prev,still no extinction)
Reaction-diffusion models • Based on diffusion and PDEs: a lot older than 20 years • Used when • space should be treated continuously • spatial proximity is key to transmission • Based on the concept of Brownian motion • reasonable for dispersing animal populations • No explicit solution, but analytic expression for the asymptotic travelling wave in isotropic environment • Successful applications: • Fox rabies: Murray, Stanley & Brown (1986) • Bubonic plague: Nobel (1974)
Basic equations • Dynamics: where: Travelling waves ( ):
Extensions: kernel-based models • Reaction-diffusion model are inadequate for, e.g. • plants (and wind-bourne spore dispersal) • farms (and market trade) • stationary agents (and long-range dispersal) • Kernel-based models: • When probability of transmission decreases with distance • Typically stochastic (also deterministic with uniform host density) • Kernel usually homogeneous and isotropic: • Analytic results: • Kernel decreases exponentially with distance travelling waves • Kernel too fat forward jump to new foci
Overview Reproduction numbers Time-dependent quantities Households models
History • First ‘attempt’ with many large groups: Bartoszyński (1972), “On a certain model of an epidemic” • Highly infectious disease: Becker &Dietz (1995) • Milestone ( , final size and vaccination ‘equalizing’ strategy): Ball, Mollison & Scalia-Tomba (1997) • Overlapping groups: Ball &Neal (2002) • Real-time growth rate (approximate): Fraser (2007); Pellis, Ferguson & Fraser (2010) • Many reproduction numbers: Goldstein et al (2009); Pellis, Ball & Trapman (2012)
Overview Reproduction numbers Time-dependent quantities Households models
Motivation • Strongest interaction • Lowest level in a hierarchical society • Concept of household is reasonably well defined (some issues) • Data availability • Homogeneous mixing is reasonably justified • Natural target of intervention • Laboratory for detailed parameter estimation Cauchemez (2004); Cauchemez et al. (2009); Donnelly et al (2011)
Considerations • Mostly SIR. Some exceptions: Ball (1999); Neal(2006) • Mostly within-household density dependence. Some exceptions: Cauchemez (2004); Cauchemez et al (2009); Fraser(2007); Pellis, Ferguson & Fraser (2009, 2011) • Mostly stochastic, because of small groups • Unless Markovian model using the Master equation House & Keeling (2008) • But many results (reproduction numbers, real-time growth rate) are ‘almost’ deterministic • Early phase (with homogeneous global mixing and large population and lack of prior immunity) is a lot simpler: • The household is infected only once • It can be treated as a super-individual
Overview Reproduction numbers Time-dependent quantities Households models
Household reproduction number R • Consider a within-household epidemic started by one initial case • Define: • average household final size, excluding the initial case • average number of global infections an individual makes • Linearise the epidemic process at the level of households:
Individual reproduction number RI • Attribute all further cases in a household to the primary case • is the dominant eigenvalue of :
Individual reproduction number RI • Attribute all further cases in a household to the primary case • is the dominant eigenvalue of :
R0 – naïve construction • Consider a within-household epidemic with a single initial case. • Type of an infective = generation they belong to. • = expected number of cases in each generation • = average number of global infections from each case • The next generation matrix is: • Then: Pellis, Ball & Trapman(2012)
Vaccine-associated reproduction number RV • Recall that, without households, • Assume • Assume a perfect vaccine • Define as the fraction of the population that needs to be vaccinated (at random) to reduce below 1 • Then such that
Conclusions • Comparison between reproduction numbers: Goldstein et al (2009); Pellis, Ball & Trapman(2012) • At the threshold: • In a growing epidemic: • In a declining epidemic: • , so vaccinating is not enough • But bracketed between two analytically tractable approximations
Extensions • Overlapping groups model: Ball & Neal (2002) • Clump-to-clump reproduction number • Households-workplaces model: Pellis, Ferguson & Fraser (2009) • Household reproduction number • Workplace reproduction number • Household-network model: Ball, Sirl & Trapman(2009) • Household reproduction number • Basic reproduction number calculated for all these extensions Pellis, Ball & Trapman(2012)
Overview Reproduction numbers Time-dependent quantities Households models
Time-related quantities • Real-time growth rate • Linearise at the level of households: where is the infectivity profile of a household • Markovian model: can be found exactly using CTMC • Non-Markovian model: only approximate results Fraser (2007); Pellis, Ferguson & Fraser (2010) • Full dynamics: Markovian model and Master equation House & Keeling (2008)
Key epidemiological quantities (Almost) exact dynamics Approximate dynamics Networks
History • A few milestones • Roots in graph theory: Euler (1736) on the 7 bridges of Köningsberg • Random graph theory: Erdős & Rényi (1959); Gilbert (1959) • Small world network: Watts & Strogatz (1998) • Scale-free network: Barabási & Albert (1999); Bollobás et al (2001) • Many different branches: • Static VS dynamic • Small VS large • Clustered VS unclustered • Correlated VS uncorrelated • Weighted VS unweighted • Markovian VS non-Markovian • SIS VS SIR
Key epidemiological quantities (Almost) exact dynamics Approximate dynamics Networks
R0 for SIR – basics • Simple case: large, static, unclustered, unweighted, - regular • is bounded • Repeated contacts: • Markovian model: prob of transmission instead of • First infective is special: • All others have 1 link less to use • Formally:
R0 for SIR – basics • Simple case: large, static, unclustered, unweighted, - regular • is bounded • Repeated contacts: • Markovian model: prob of transmission instead of • First infective is special: • All others have 1 link less to use • Formally:
R0 for SIR – extensions • Degree-biased (or excess degree) distribution: • A node of degree is times more likely to be reached than a node of degree 1 • A node of degree is times more susceptible and times more infectious • So ( mean and variance): • Next-generation matrix (NGM) approach: • Degree correlation • Weighted networks • Bipartite networks • Dynamic network: Slow dynamics Fast dynamics Markovian example:
R0 for SIR – clustering • Clustering by triangles Newman (2009), “Random graphs with clustering” • Clustering by asymptotic expansion on transmissibility (and weighted network) Miller (2009), “Spread of infectious diseases in clustered networks” • Clustering by households: • Use tools from households models to get and Ball, Sirl& Trapman(2010), “Analysis of a stochastic SIR epidemic on a random network incorporating household structure” Pellis, Ball & Trapman(2012), “Reproduction numbers for epidemic models with households and other social structures. I. Definition and calculation of R0” Ball, Britton & Sirl(2013), “A network with tunable clustering, degree correlation and degree distribution, and an epidemic thereon” • There is a lot more than just this type of clustering: House & Del Genio(in preparation)
Real-time growth rate • Assume: • Infection rate on each link at time after infection • The network is static and independent from the infectivity profile • No clustering • Then the real-time growth rate is the solution of: where • The story is not very different from
Key epidemiological quantities (Almost) exact dynamics Approximate dynamics Networks
Small populations • Requires a Markovian model (constant rates) • Master equation: • is the distribution over all possible system states • Problem: curse of dimensionality • Automorphism-driven lumping: Simon, Taylor & Kiss (2011) • Allows reducing the number of equations by exploiting symmetry • Still curse of dimensionality • No reduction at all if there are no symmetries
Large populations • Requirements: Markovian model and configuration network • Basic deterministic models: • Effective degree (ED) model: Ball & Neal (2008), “Network epidemic models with two levels of mixing” • ‘Probability generating function’ (PGF) model: Volz (2008), “SIR dynamics in random networks with heterogeneous connectivity” Miller (2011), “A note on a paper by Erik Volz: SIR dynamics in random networks” • Effective degree (ED2) model Lindquist et al (2011), “Effective degree network disease models” • Some extensions: • Clustered networks: Volz(2010) • Dynamic networks: Volz & Meyers (2007)
Effective degree (ED) model • Proved to be exact (mean behaviour, conditional on non-extinction) • Assumptions: • number of S and I nodes of effective degree • ED at : number of links still available for transmission • A node decreases its ED by one when infected by or transmitting to a neighbour, or when a neighbour recovers
Effective degree (ED) model • Proved to be exact (mean behaviour, conditional on non-extinction) • Assumptions: • number of S and I nodes of effective degree • ED at : number of links still available for transmission • A node decreases its ED by one when infected by or transmitting to a neighbour, or when a neighbour recovers Infecting Being infected Being contacted Neighbour recovering
Effective degree (ED) model • Proved to be exact (mean behaviour, conditional on non-extinction) • Assumptions: • number of S and I nodes of effective degree • ED at : number of links still available for transmission • A node decreases its ED by one when infected by or transmitting to a neighbour, or when a neighbour recovers Infecting Being infected Being contacted Neighbour recovering
Effective degree (ED) model • Proved to be exact (mean behaviour, conditional on non-extinction) • Assumptions: • number of S and I nodes of effective degree • ED at : number of links still available for transmission • A node decreases its ED by one when infected by or transmitting to a neighbour, or when a neighbour recovers Infecting Being infected Being contacted Neighbour recovering
Effective degree (ED) model • Proved to be exact (mean behaviour, conditional on non-extinction) • Assumptions: • number of S and I nodes of effective degree • ED at : number of links still available for transmission • A node decreases its ED by one when infected by or transmitting to a neighbour, or when a neighbour recovers Infecting Being infected Being contacted Neighbour recovering