Download
1 / 11
110 likes | 117 Views
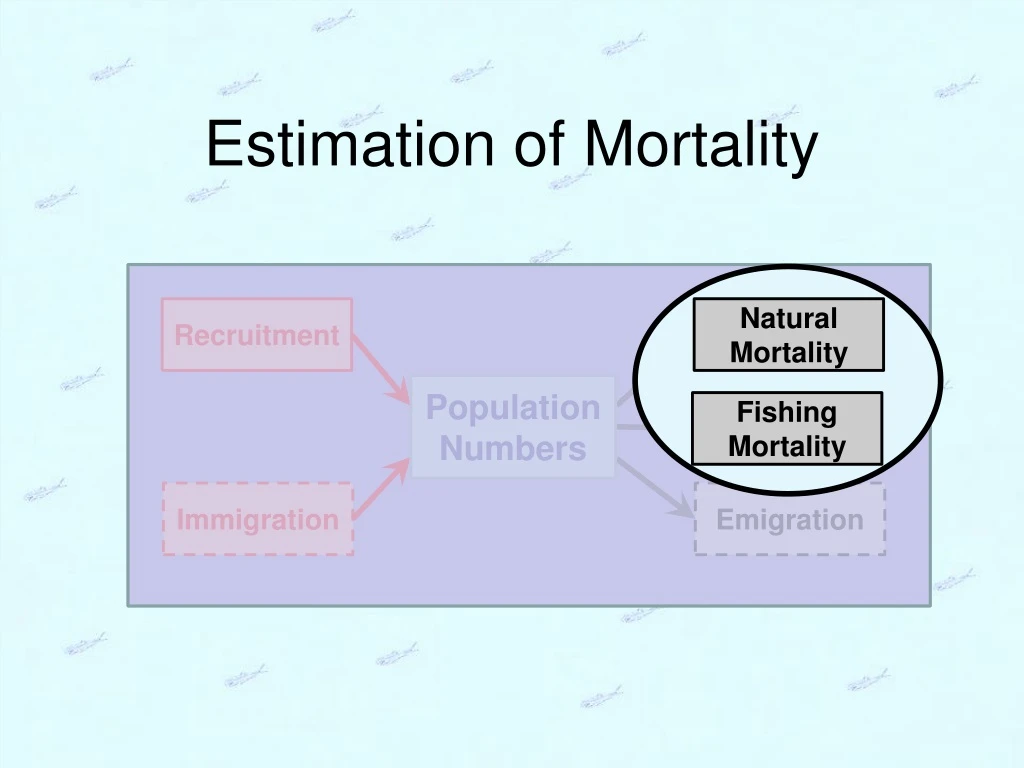
Estimation of Mortality. Recruitment. Natural Mortality. Population Numbers. Fishing Mortality. Immigration. Emigration. Recall. Discrete Population Growth Model N t+1 = (1+r) N t where r = b-d+i-e Suppose that … … population is closed … following the same group of fish

E N D
Estimation of Mortality Recruitment Natural Mortality Population Numbers Fishing Mortality Immigration Emigration
Recall • Discrete Population Growth Model • Nt+1 = (1+r)Nt • where r = b-d+i-e • Suppose that … • … population is closed • … following the same group of fish • Thus, r = -d but d is usually replaced with A • A is the annual mortality rate • Solve for A Catch Curves
Mortality Rate Concept • For example, N1 = 1000 and N2 = 850. • What is the mortality rate? • What is the survival rate? • S is an annual survival rate • Note that A+S = 1 • Such that S=1-A or A=1-S Catch Curves
Instantaneous Mortality Rate (Z) • Similarly examine continuous model … • r = -d but replace d with Z such that Nt+1 = Nte-Z • solve for Z • thus, Z is an instantaneous mortality rate • Note that S=e-Z and A = 1-e-Z Catch Curves
Two Problems • Population sizes are not usually “seen.” • Z can be computed from CPEs • Recall that Ct = qftNt • Algebraically show that Z=log(CPEt)-log(CPEt+1) • Catches or CPEs are subject to variability • Catches are samples; Z is, thus, a statistic. • If a cohort is followed over time, individual estimates of Z can be made and averaged. Catch Curves
Example Calculations IDEAL REAL t Nt Ct Ct* 0 1000 200 211 1 800 160 159 2 640 128 126 3 512 102 104 4 410 82 81 5 328 66 64 • Calculate Z from each time step of … • population sizes. • idealistic catches. • realistic catches. • composite (average) of realistic catches. Catch Curves
Catch Curve • Longitudinal • Catch-at-age for a single cohort of fish. • Cross-sectional • Catch-at-age in a single year (across many cohorts of fish). Catch Curves
Longitudinal vs. Cross-Sectional Catch-at-age across several capture years. Capture Year Age2009 2010 2011 2012 2013 2014 2015 2016 0 200 200 200 200 200 200 200 200 1 160 160 160 160 160 160 160 160 2 128 128 128 128 128 128 128 128 3 102 102 102 102 102 102 102 102 4 82 82 82 82 82 82 82 82 5 66 66 66 66 66 66 66 66 • What is the cross-sectional catch-at-age for 2012? • What is the longitudinal catch-at-age for the 2010 year-class? • Longitudinal=cross-sectional if Z and N0 are constant across time and cohorts. Catch Curves
Catch Curve Model • Recall: CPEt= qNtand Nt = N0e-Zt • Substitute second into first … CPEt= qN0e-Zt • Can this be linearized? • What is estimate of Z? 200 160 CPE 120 80 0 1 2 3 4 5 Age / Time Catch Curves
4.0 3.5 3.0 2.5 log(CPE) 2.0 1.5 1.0 0.5 0 2 4 6 8 10 Age / Time Catch Curve Characteristics • Fit regression of log(CPE) on age only for ages on descending limb. -Z 1 -Z 1 Descending Asc Dome Catch Curves
Catch Curve Assumptions • Population closed to immigration and emigration. • Z is constant. • q is constant • “Sample” is unbiased regarding any age-group (i.e., be careful of selective gears) • Accurate ages • Follow a cohort (if longitudinal CC used) • Recruitment on descending limb is constant (if cross-sectional CC used) Catch Curves