Download
1 / 25
250 likes | 476 Views
Remaining Lectures in 2009. Advanced Clustering and Outlier Detection Advanced Classification and Prediction Top Ten Data Mining Algorithms (short) Course Summary (short) Assignment5 Student Presentations . Clustering Part2: Advanced Clustering and Outlier Detection .

E N D
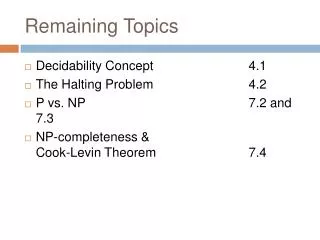
Remaining Lectures in 2009 • Advanced Clustering and Outlier Detection • Advanced Classification and Prediction • Top Ten Data Mining Algorithms (short) • Course Summary (short) • Assignment5 Student Presentations
Clustering Part2: Advanced Clustering and Outlier Detection • Hierarchical Clustering • More on Density-based Clustering: DENCLUE • [EM Top10-DM-Alg] • Cluster Evaluation Measures • Outlier Detection
More on Clustering • Hierarchical Clustering to be discussed in Nov. 11 • DBSCAN will be used in programming project
Hierarchical Clustering • Produces a set of nested clusters organized as a hierarchical tree • Can be visualized as a dendrogram • A tree like diagram that records the sequences of merges or splits
Agglomerative Clustering Algorithm • More popular hierarchical clustering technique • Basic algorithm is straightforward • Compute the proximity matrix • Let each data point be a cluster • Repeat • Merge the two closest clusters • Update the proximity matrix • Until only a single cluster remains • Key operation is the computation of the proximity of two clusters • Different approaches to defining the distance between clusters distinguish the different algorithms
p1 p2 p3 p4 p5 . . . p1 p2 p3 p4 p5 . . . Starting Situation • Start with clusters of individual points and a proximity matrix Proximity Matrix
C1 C2 C3 C4 C5 C1 C2 C3 C4 C5 Intermediate Situation • After some merging steps, we have some clusters C3 C4 Proximity Matrix C1 C5 C2
C1 C2 C3 C4 C5 C1 C2 C3 C4 C5 Intermediate Situation • We want to merge the two closest clusters (C2 and C5) and update the proximity matrix. C3 C4 Proximity Matrix C1 C5 C2
After Merging • The question is “How do we update the proximity matrix?” C2 U C5 C1 C3 C4 C1 ? ? ? ? ? C2 U C5 C3 C3 ? C4 ? C4 Proximity Matrix C1 C2 U C5
p1 p2 p3 p4 p5 . . . p1 p2 p3 p4 p5 . . . How to Define Inter-Cluster Similarity Similarity? • MIN • MAX • Group Average • Distance Between Centroids • Other methods driven by an objective function • Ward’s Method uses squared error Proximity Matrix
p1 p2 p3 p4 p5 . . . p1 p2 p3 p4 p5 . . . How to Define Inter-Cluster Similarity • MIN • MAX • Group Average • Distance Between Centroids • Other methods driven by an objective function • Ward’s Method uses squared error Proximity Matrix
p1 p2 p3 p4 p5 . . . p1 p2 p3 p4 p5 . . . How to Define Inter-Cluster Similarity • MIN • MAX • Group Average • Distance Between Centroids • Other methods driven by an objective function • Ward’s Method uses squared error Proximity Matrix
p1 p2 p3 p4 p5 . . . p1 p2 p3 p4 p5 . . . How to Define Inter-Cluster Similarity • MIN • MAX • Group Average • Distance Between Centroids • Other methods driven by an objective function • Ward’s Method uses squared error Proximity Matrix
p1 p2 p3 p4 p5 . . . p1 p2 p3 p4 p5 . . . How to Define Inter-Cluster Similarity • MIN • MAX • Group Average • Distance Between Centroids • Other methods driven by an objective function • Ward’s Method uses squared error Proximity Matrix
1 2 3 4 5 Cluster Similarity: Group Average • Proximity of two clusters is the average of pairwise proximity between points in the two clusters. • Need to use average connectivity for scalability since total proximity favors large clusters
2009 Teaching of Clustering • Clustering Part1: Basics (September/October) • What is Clustering? • Partitioning/Representative-based Clustering • K-means • K-medoids • Density Based Clustering centering on DBSCAN • Region Discovery • Grid-based Clustering • Similarity Assessment • Clustering Part2: Advanced Topics (November)
DBSCAN (http://www2.cs.uh.edu/~ceick/7363/Papers/dbscan.pdf ) • DBSCAN is a density-based algorithm. • Density = number of points within a specified radius (Eps) • Input parameter: MinPts and Eps • A point is a core point if it has more than a specified number of points (MinPts) within Eps • These are points that are at the interior of a cluster • A border point has fewer than MinPts within Eps, but is in the neighborhood of a core point • A noise point is any point that is not a core point or a border point.
DBSCAN Algorithm (simplified view for teaching) • Create a graph whose nodes are the points to be clustered • For each core-point c create an edge from c to every point p in the -neighborhood of c • Set N to the nodes of the graph; • If N does not contain any core points terminate • Pick a core point c in N • Let X be the set of nodes that can be reached from c by going forward; • create a cluster containing X{c} • N=N/(X{c}) • Continue with step 4 Remarks: points that are not assigned to any cluster are outliers; http://www2.cs.uh.edu/~ceick/7363/Papers/dbscan.pdf gives a more efficient implementation by performing steps 2 and 6 in parallel
DBSCAN: Core, Border and Noise Points Original Points Point types: core, border and noise Eps = 10, MinPts = 4
Clusters When DBSCAN Works Well Original Points • Resistant to Noise • Can handle clusters of different shapes and sizes
When DBSCAN Does NOT Work Well (MinPts=4, Eps=9.75). Original Points Problems with • Varying densities • High-dimensional data (MinPts=4, Eps=9.12)
Assignment3 Dataset: Complex9 http://www2.cs.uh.edu/~ml_kdd/Complex&Diamond/2DData.htm Dataset: http://www2.cs.uh.edu/~ml_kdd/Complex&Diamond/Complex9.txt K-Means in Weka DBSCAN in Weka
DBSCAN: Determining EPS and MinPts • Idea is that for points in a cluster, their kth nearest neighbors are at roughly the same distance • Noise points have the kth nearest neighbor at farther distance • So, plot sorted distance of every point to its kth nearest neighbor Run DBSCAN for Minp=4 and =5 Non-Core-points Core-points