Download
1 / 12
130 likes | 171 Views
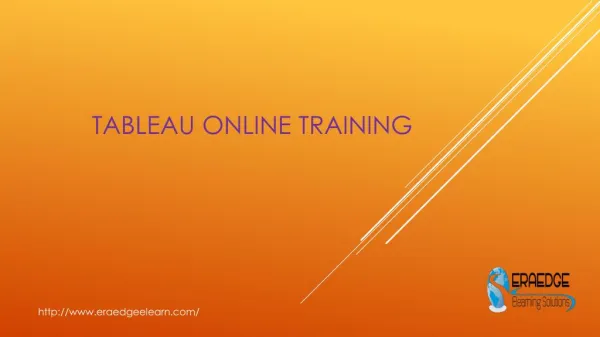
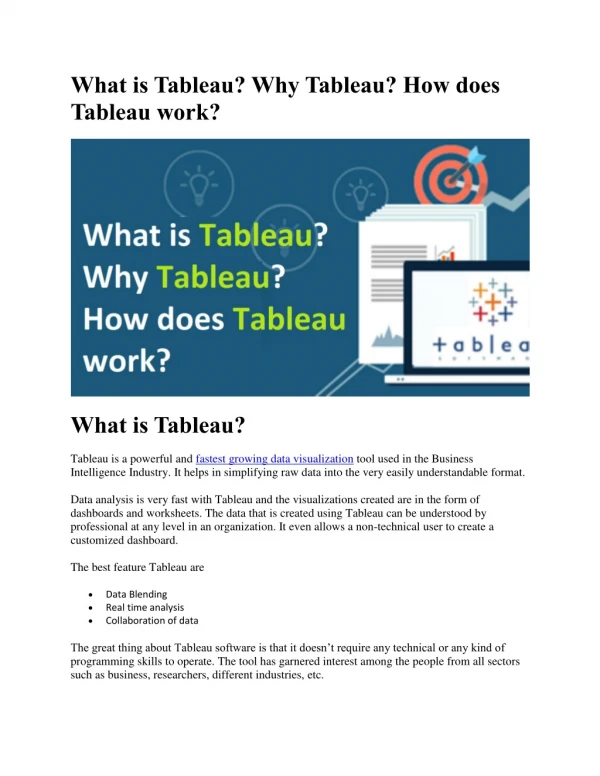
The Course will speak about reporting tool, Architecture and what is the importance of reporting in industry and how we can basically use Tableau to achieve the objective .

E N D
The Course will speak about reporting tool , Architecture and what is the importance of reporting in industry and how we can basically use Tableau to achieve the objective .
By the end of this class, the student will be able to: Understand the many options for connecting to data
Understand the Tableau interface / paradigm – components, shelves, data elements, and terminology. The student will be able to use this knowledge to effectively create the most powerful visualizations
Create basic calculations including string manipulation, basic arithmetic calculations, custom aggregations and ratios, date math, logic statements and quick table calculations
Able to represent your data using the following visualization types: Cross Tab Geographic Map Page Trails
Heat Map Density Chart Scatter Plots Pie Chart and Bar Charts
Small Multiples Dual Axis and Combo Charts with different mark types Options for drill down and drill across
Use Trend Lines, Reference Lines and statistical techniques to describe your data Understanding how to use group, bin, hierarchy, sort, set and filter options effectively Work with the many formatting options to fine tune the presentation of your visualizations
Understand how and when to Use Measure Name and Measure Value Understand how to deal with data changes in your data source such as field addition, deletion or name change
Understand all of your options for sharing your visualizations with others Combine your visualizations into Interactive Dashboards and publish them to the web
For more information please visit our websites: https://www.edusmartskills.in https://www.edusmartskills.com