Download
1 / 27
270 likes | 495 Views
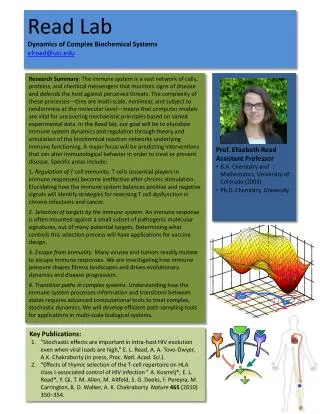
Dynamics in Complex Chemical Systems. Biman Bagchi Indian Institute of Science Bangalore - 560012. Complex Chemical Systems of Interest. *1. Vibrational Relaxation Near the Gas-Liquid Critical Point.

E N D
Dynamics in Complex Chemical Systems Biman BagchiIndian Institute of ScienceBangalore - 560012
Complex Chemical Systems of Interest *1. Vibrational Relaxation Near the Gas-Liquid Critical Point. *2. Kerr (Orientational) Relaxation Near the Isotropic-Nematic Phase transition in Liquid Crystalline Materials *3. Transport in Supercooled Liquids. 4. Micellar and Protein Hydration Dynamics 5. Folding of Globular and Non-globular proteins : Correlation Between Energy Landscape, Topology and Kinetics
Experimental Observation » The Linewidth of fundamental (0,1) (isotropic) Raman band of N2 along, * the solid-gas coexistence line, * the liquid-gas coexistence line, and * In the isochoric state for critical (circles) and supercritical sample (squares). M. Mussoet al.JCP116, 8015 (2002) PRL 85, 3850 (2003)
What is dephasing ? b w a If the state of a single two-level atom is: ρ(t) or ρ(t) are the population densities of states and . The density matrix, rij(t), is defined as: When laser beams with different k-vectors excite the atom, rij(t) tends to have a spatially sinusoidal variation. A grating is said to exist if ρaa(t) or ρbb(t)is spatially sinusoidal, A coherence is said to exist if rab(t) or rba(t) is spatially sinusoidal.
The main questions attempted to answer: • According to Mukamel, Ronis et al., the divergence of linewidth reflect the growing critical fluctuations near the gas-liquid critical point (CP). • However, the decay of frequency modulation time correlation function is rather fast 100 fs (0.1 ps) • Understanding the role of vibration-rotation coupling to the dephasing rate near CP Mukamel et al. PRL 50, 590 (1983)
Theoretical Analysis: Kubo-Oxtoby Formalism » The isotropic Raman Spectrum is given by Polarizability along Q coordinate »The Raman Line shape can be written as,
» The fluctuation in energy between the ground state and the nth quantum level is given by Resonance Term Density Term » The Vibration-Rotation (VR) contribution to the broadening of the line shape is given by
Simulation Results: Tc »-shaped Raman linewidth of Nitrogen
Simulation Results: Tc » The RMS Frequency fluctuation (∆) vs. temperature (T) along the critical isochore for N2. We fitted all simulation points with Gaussian.
Dynamical heterogeneities near the critical point (T = 125.3K).
Mode Coupling Theory analysis (MCT) The density () dependent frequency modulation time correlation function Near Critical Point (CP), k 0 The MCT gives the cross-correlation between VR coupling and density term in terms of triplet direct correlation The large enhancement of vibration-rotation coupling near critical point (CP) arises from the non-Gaussian behavior of density fluctuation and this enters through a nonzero value of the triplet direct correlation Roychowdhury and BagchiJCP 119, 3278 (2003)
V is the oscillator-medium interaction potential and the fluctuation in overtone frequency between the 0 and n-th level of ith molecule : MCT gives the density dependence frequency fluctuations time correlation function :
The large enhancement vibration-rotation coupling near gas-liquid critical point arises from the non-Gaussian behavior of triple direct correlation function ( using MCT) :
Summary • The nonmonotonic dependence of RMS frequency fluctuation on temperature along critical isochore.. • A -shaped dependence of linewidth near the CP. • A near divergence of linewidth near the CP. • Enhanced role of vibration-rotation coupling not anticipated in earlier studies. • Mode coupling theory analysis and growth of heterogeneity.
II.Vibrational dephasing via Concentration fluctuations of Binary liquid mixtures The role of density and concentration fluctuations in liquid binary mixture on the linewidth of vibrational spectra. Concentration fluctuations are most promising mechanism for experimentally observing the effects of attractive intermolecular forces on vibrational motion. Lindenberger et al. J. Phys. Chem. A 1999,103,5655-5660
Experimental Result » Measured effective dephasing time T2(open squares) and average correlation time c (full points) of the 1 mode of CH3I vs. mole fraction x of CH3I in the mixture with CDCl3.
NPT Simulation Result: Binary Liquid mixture Non-monotonic composition dependence as observed in experiments
Model Binary Mixture The LJ parameters for the A system were taken as A/kB = 146.46K and A = 3.85°A and, for the B as B/kB = 400K and B = 4°A. The LJ parameters of AB intermolecular interaction are taken as AB/kB = 467K and AB = 4.6 A Partial radial distribution functions, gAA(r*) (solvent-solvent), gBB(r*) (solute-solvent), and gAB(r*) (solute-solute) at 0.5 solute composition (A). r* = r/A, where A is the molecular diameter of species A.
Ultrafast decay Slow decay The frequency modulation time correlation functions [Cω(t)] at different compositions of the solute (A). Inset show the same up to 0.4 ps.
The frequency dependent Raman line shape at four different compositions in the binary mixture. Note that the frequency is in reduced unit.
The probability distribution of the frequency modulation at the different compositions, (a) A = 0.20, (b) A = 0.50, (c) A = 0.75, and (d) A = 1.00.
The mean square frequency modulation (<ω2(0) >) of A - B bond at different compositions of solute (A). The values of < ω2(0) >c at different mole fraction of the solute (A). We fitted all the points with the third degree polynomial (cubic fit).
The calculated average dephasing time (solid circle, v) and the viscosity (star, *) for different mole fractions A. The solid line is the quadratic fit for v and the dotted line is the spline fit for *.
The values of the product v at different compositions of solute (A) in the binary mixture.
Protein and Micellar Hydration Dynamics Dynamic Exchange Model of Slow Relaxation (1996) Experimental Results from Fleming, Bhattacharyya and Zewail Groups (2002) Computer Simulations on Aqueous Micelles
Hydration Layer around a Protein Surface • Bound water • Quasifree water • 3) Free Water Change in poential experienced by the different types of water molecules
Alzheimer disease and -amyloid Before Alzheimer After Alzheimer Cerebral Cortex Basal forebrain Hippocampus ; essential for memory storage