Download
1 / 28
280 likes | 370 Views
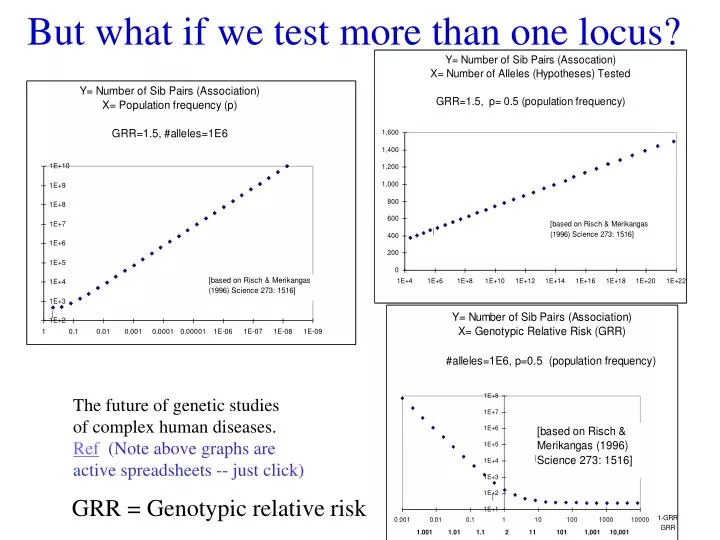
But what if we test more than one locus?. The future of genetic studies of complex human diseases. Ref (Note above graphs are active spreadsheets -- just click). GRR = Genotypic relative risk. Why multiple genes? alleles?. covariance cis & trans Haplotyping Multiple loci models

E N D
But what if we test more than one locus? The future of genetic studies of complex human diseases. Ref(Note above graphs are active spreadsheets -- just click) GRR = Genotypic relative risk
Why multiple genes? alleles? covariance cis & trans Haplotyping Multiple loci models (additive, multiplicative, mean…)
SNPs & Covariance in proteins Risk ratio: e2/3=0.5 ; e3/3=1; e3/4=2.5 ; e4/4=15 ApoE e4 RRR e3 RCR e2 RCC (61 112 158) Ancestral = Thr 61 Arg 112
1 72 " " Covariance in RNA ref
Covariance TyC anticodon 3’acc D-stem Mij= Sfxixjlog2[fxixj/(fxifxj)] M=0 to 2 bits; x=base type xixjsee Durbin et al p. 266-8.
Mutual Information ACUUAU M1,6= S = fAU log2[fAU/(fA*fU)]... CCUUAGx1x6 GCUUGC =4*.25log2[.25/(.25*.25)]=2 UCUUGA i=1j=6M1,2= 4*.25log2[.25/(.25*1)]=0 Mij= Sfxixjlog2[fxixj/(fxifxj)] M=0 to 2 bits; x=base type xixjsee Durbin et al p. 266-8. See Shannon entropy, multinomial Grendar
Dulbecco R. (1986) A turning point in cancer research: sequencing the human genome. Science 231:1055-6 Trastuzumab[Herceptin], Imatinib[Gleevec] : Normal, sensitive, & resistant alleles Mutations G719S, L858R, Del746ELREA in red. EGFR Mutations in lung cancer: correlation with clinical response to Gefitinib [Iressa] therapy. Paez, … Meyerson (Apr 2004) Science 304: 1497 Lynch … Haber, (Apr 2004) New Engl J Med. 350:2129. Pao .. Mardis,Wilson,Varmus H, PNAS (Aug 2004) 101:13306-11. Wang Z, et al. 2004 Science 304:1164. Mutational analysis of the tyrosine phosphatome in colorectal cancers.
Pharmacogenomic tests Abacavir HIV-AIDS HLA B5701 & 1502 Warfarin Anti-Clot CYP2C9 & VKCoR Imatinib Cancer BCR-ABL Irinotecan Cancer UGT1A1 5Fluorouracil Cancer DPYD-TYMS Tamoxifen Cancer CYP2D6 Long-QT Cardiac Familion Mercaptopurine Cancer TPMT Clozapine Anti-psychotic HLA-DQB1 Clopidogrel Anti-Clot CYP2C19
Nutrigenomics/pharmacogenomics Lactose intolerance: C/T(-13910) lactase persistence/non functions in vitro as a cis element 14kbp upstream enhancing the lactase promoter http://www.genecards.org/cgi-bin/carddisp.pl?gene=LCT
Nutrigenomics/pharmacogenomics Thiopurine methyltransferase (TPMT) metabolizes 6-mercaptopurine and azathiopurine, two drugs used in a range of indications, from childhood leukemia to autoimmune diseases CYP450 superfamily: CYP2D6 has over 75 known allelic variations, 30% of people in parts of East Africa have multiple copies of the gene, not be adequately treated with standard doses of drugs, e.g. codeine (activated by CYP2D6).
Human metabolic Network (Recon 1) Duarte et al. reconstruction of the human metabolic network based on genomic and bibliomic data. PNAS 2007 104:1777-82. E.coli: 1200 ORFs http://gcrg.ucsd.edu/organisms
Steady-state flux optima RC Flux Balance Constraints: RA< 1 molecule/sec (external) RA = RB(because no net increase) x1 + x2< 1 (mass conservation) x1 >0 (positive rates) x2 > 0 C x1 RB RA A B x2 D RD x2 Max Z=3 at (x2=1, x1=0) Feasible flux distributions Z = 3RD + RC (But what if we really wanted to select for a fixed ratio of 3:1?) x1
Applicability of LP & FBA • Stoichiometry is well-known • Limited thermodynamic information is required • reversibility vs. irreversibility • Experimental knowledge can be incorporated in to the problem formulation • Linear optimization allows the identification of the reaction pathways used to fulfil the goals of the cell if it is operating in an optimal manner. • The relative value of the metabolites can be determined • Flux distribution for the production of a commercial metabolite can be identified. Genetic Engineering candidates
Precursors to cell growth • How to define the growth function. • The biomass composition has been determined for several cells, E. coli and B. subtilis. • This can be included in a complete metabolic network • When only the catabolic network is modeled, the biomass composition can be described as the 12 biosynthetic precursors and the energy and redox cofactors
in silico cells E. coli H. influenzae H. pylori Genes 695 362 268 Reactions 720 488 444 Metabolites 436 343 340 (of total genes 4300 1700 1800) Edwards, et al 2002. Genome-scale metabolic model of Helicobacter pylori 26695. J Bacteriol. 184(16):4582-93. Segre, et al, 2002 Analysis of optimality in natural and perturbed metabolic networks. PNAS 99: 15112-7. (Minimization Of MetabolicAdjustment )http://arep.med.harvard.edu/moma/
Where do the Stochiometric matrices (& kinetic parameters) come from? EMP RBC, E.coli KEGG, Ecocyc
Biomass Composition ATP GLY LEU coeff. in growth reaction ACCOA NADH FAD SUCCOA COA metabolites
Flux ratios at each branch point yields optimal polymer composition for replication x,y are two of the 100s of flux dimensions
C009-limited 200 WT (LP) 180 7 8 160 140 9 120 10 Predicted Fluxes r=0.91 p=8e-8 100 11 14 13 12 3 1 80 60 40 16 20 2 6 5 15 4 17 18 0 0 50 100 150 200 Experimental Fluxes 250 250 Dpyk (LP) Dpyk (QP) 200 200 18 7 r=0.56 P=7e-3 8 r=-0.06 p=6e-1 150 150 7 8 2 Predicted Fluxes Predicted Fluxes 10 9 13 100 9 100 11 12 3 1 14 10 14 13 11 12 3 50 50 5 6 4 16 16 2 15 5 6 18 17 15 17 0 0 4 1 -50 -50 -50 0 50 100 150 200 250 -50 0 50 100 150 200 250 Experimental Fluxes Experimental Fluxes
Competitive growth data: reproducibility Correlation between two selection experiments Badarinarayana, et al. Nature Biotech.19: 1060
Competitive growth data On minimal media negative small selection effect C 2 p-values 4x10⁻³ 1x10⁻⁵ LP QP Novel redundancies Position effects Hypothesis: next optima are achieved by regulation of activities.
Co-evolution of mutual biosensors/biosynthesissequenced across time & within each time-point Independent lines of TrpD & TyrD co-culture 5 OmpF: (pore: large,hydrophilic > small) 42R-> G,L,C, 113 D->V, 117 E->A 2 Promoter: (cis-regulator) -12A->C, -35 C->A 5 Lrp: (trans-regulator) 1bD, 9bD, 8bD, IS2 insert, R->L in DBD. Heterogeneity within each time-point . Reppas, Shendure, Porecca
Non-optimal evolves to optimal Ibarra et al.Nature. 2002 Nov 14;420(6912):186-9. Escherichia coli K-12 undergoes adaptive evolution to achieve in silico predicted optimal growth.
Metabolic optimization readings Duarte et al. reconstruction of the human metabolic network based on genomic and bibliomic data. Proc Natl Acad Sci U S A. 2007 Feb 6;104(6):1777-82. Joyce AR, Palsson BO. Toward whole cell modeling and simulation: comprehensive functional genomics through the constraint-based approach. Prog Drug Res. 2007;64:265, 267-309. Review. Herring, et al. Comparative genome sequencing of Escherichia coli allows observation of bacterial evolution on a laboratory timescale. Nat Genet. 2006 38:1406-12. Desai RP, Nielsen LK, Papoutsakis ET. Stoichiometric modeling of Clostridium acetobutylicum fermentations with non-linear constraints. J Biotechnol. 1999 71:191-205.