Download
1 / 24
240 likes | 389 Views
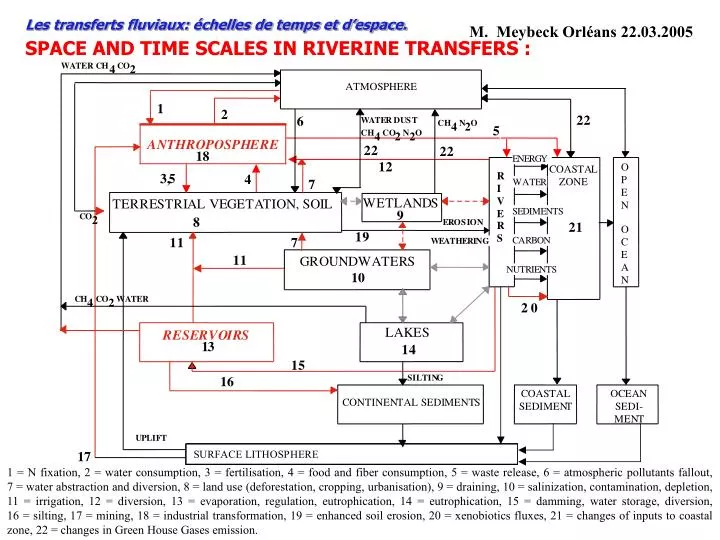
Les transferts fluviaux: échelles de temps et d’espace. SPACE AND TIME SCALES IN RIVERINE TRANSFERS : . M. Meybeck Orléans 22.03.2005.

E N D
Les transferts fluviaux: échelles de temps et d’espace. SPACE AND TIME SCALES IN RIVERINE TRANSFERS : M. Meybeck Orléans 22.03.2005 1 = N fixation, 2 = water consumption, 3 = fertilisation, 4 = food and fiber consumption, 5 = waste release, 6 = atmospheric pollutants fallout, 7 = water abstraction and diversion, 8 = land use (deforestation, cropping, urbanisation), 9 = draining, 10 = salinization, contamination, depletion, 11 = irrigation, 12 = diversion, 13 = evaporation, regulation, eutrophication, 14 = eutrophication, 15 = damming, water storage, diversion, 16 = silting, 17 = mining, 18 = industrial transformation, 19 = enhanced soil erosion, 20 = xenobiotics fluxes, 21 = changes of inputs to coastal zone, 22 = changes in Green House Gases emission.
NATURAL ORIGINS AND PATHWAYS OF RIVER PARTICULATES ATMOSPHERIC FALLOUT U 16 RIVER BED INCISION NATURAL SOIL EROSION 2 1 S1 15 b S5 S6 S7 15 a S4 S2 S3 14 13 3 4 5 6 7 8 9 10 11 12 ALLUVIAL PLAINS SINKS & EXCHANGES DELTAIC SEDIMENT SLOPES LAKES RIVER BED COASTAL SEDIMENT MIDDLE/LOWER COURSE ESTUARY/DELTA COAST UPPER COURSE • In natural conditions, sediment transfert is a succession of sources and sinks : delivery ratio is usually 10 to 20 % • Sediment survey may capture different pictures of this transfer
FLUVIAL FILTERING SCHEMATIC POSITION OF RIVER MATERIAL FILTERS WITHIN PRISTINE RIVER SYSTEMS. FILTERS POSITIONS ATMOSPHERE AGRIC. HUMANS Fev F1 F2 VEG F3 SOIL SOIL F0 ARHEIC GW Fev F4 RHEIC COAST ARHEIC F5 COAST F0 SLP WL LK FLP EST Sédim. deposition FILTERS Biogeoch. cycling SED SED SED SED SED Gaz escape; evap. F1 F2 F3 F4 F5 In addition to the soil/plant filter (F0), different types of filters control the pathways and transfers of river borne material: slopes and piedmonts (F1), headwaters wetlands (F2), lakes (F3), inundated floodplain (F4) and estuaries (F5). Human impacts are very limited.
S V J2 U T Q1 P R J1 E Q2 G1 G2 B C E A F H G1 D L O J K N 100 km M SEINE BASIN ANALYSIS SPATIAL DISTRIBUTION OF PARIS IMPACTS ON THE SEINE RIVER UPPER SEINE MARNE SEINE OISE F • Paris megacity (10 M people), 2 500 km2 has been the major driving force of the Seine basin for the last 1000 years • Flow regulation, channelization, sand extraction, waste water release are among the major pressures
C/CN Paris SEINE BASIN ANALYSIS STREAM ORDER PROFILES OF AVERAGE WATER QUALITY C/CN C/Cout Paris • Space distribution of water quality indicator is highly dependant on stream order/ population density/types of human pressure • Normalized indicators permit space analysis BGR : Orders 1 to 2 forested AGR : Orders 1 to 3 rural (<20 p/km2)
SEINE BASIN ANALYSIS IMPACT PROFILES OF PARIS MEGACITY ON THE SEINE RIVER 2 4 IMPACT SEVERITY 6 1 A 7 SEVERE 1 B 3 5 MODERATE ENGLISH CHANNEL NEGLIGIBLE EXTERNAL DISTAL PROXIMAL LOCAL PROXIMAL DISTAL EXTERNAL PARIS MEGACITY SEINE ESTUARY 400 200 70 200 50 0 300 km 1.A, 1.B Organic Pollution 2. Combined Sewer Overflow 3. Estuarine nitrification 4. Metal Contamination 5. Habitat degradation 6. Atmopsheric pollution 7. Timber rafting (1600-1920)
Sub pristine environment Sediment FLUVIAL FILTERING FLUVIAL SYSTEM FUNCTIONING IN THE ANTHROPOCENE POLLUTED/REGULATED FLUVIAL SYSTEM FILTERS POSITIONS J MINING ENERGY LRAP NET STORAGE ATMOSPHERE IND TRANSP LRAP J URB F0 F1 AGRI WD STP Fev F3 A F1 F2 CROP A VEGETATION CROP IRRIGATED FIELD H Fo F7 SOIL GROUNDWATER F4 F7 D E G H I B C F6 C SLP WL LK FLPL EST RESERV COAST E H D F1 F2 F3 F6 F4 F5 F1 F5 Coast Socio economic systems F6 F7 Artificial filters Evaporation Artificial river network Agrochemicals Contaminated water Impacted/regulated environment Material, information and financial fluxes within anthroposhere Fluxes of contaminants Regulated water flux Transition environment Crop Pristine water Natural filters F0 / F5
EXAMPLES OF RESERVOIRS IMPACTS ON LAND-OCEAN FLUXESIn the Mediterranean watershed the sediment load has been reduced from 620 M t/y to 180 M t/y.Globally the sediment storage in large dams is 5 billions t/y (circa 25% of present flux) ; could be double if small reservoirs are considered.In dry regions impoundments are associated with water losses through evapotranspiration for irrigation (2,55 M km2 globally) and marked reduction of river flows to oceans, towards "neoarheism" as :Asia : Amu Darya, Syr Daria, Yellow, IndusNorth America : Colorado, Rio GrandeAfrica : Nile, OrangeAustralasia : Murray
EUTROPHICATION RIVER EUTROPHICATION : DAILY pH CYCLES IN THE LOIRE RIVER(AT DAMPIERRE) ∆pH Discharge PA68 F. Moatar (1999, Univ. Tours) • During spring and summer algal blooms (chloro A > 100 µg/L) the daily pH cycles may reach 1.2 pH units • Such events can only be noted during stable low flows : they are destroyed by floods
EUTROPHICATION NITRATE TRENDS IN WORLD RIVERS Thames From 1960 to 1990 nitrate has increased in most large rivers Maximum rates are observed in smaller catchments exposed to intensive fertilizer use Seine Rhine Danube Mississippi SD11
EUTROPHICATION A SUCCESS STORY : NUTRIENTS CONTROL IN THE RHINE R. mg P /L Van Dijk & Marteijn, 1993 • The major effort of sewage collection was between 1960 and 1975 : it resulted in particulate P abatment and NH4+ decrease • P-PO43- control then decrease was only achieved after the 1985 ban of P detergents and the dephosphatation in most treatment plants
CONTAMINATION SCHEMATIC TRENDS OF SEDIMENT CONTAMINATION IN ESTUARINE CORES TE3 • Heavy metals (A) have peaked in the 1960 ’s (USA) to the 1980 ’s (some W. Europe rivers), their trends are barely documented on other continents • Carcinogenic polyaromatic carbons may still increase in some regions • Polychlorinated biphenyls do not exist in nature (xenobiotics) : they trace the modern human pressure • Both PAHs and PCBs are inadequately surveyed in rivers
0,01 1 10 1000 CONTAMINATION HERITAGE OLDEST HUMAN IMPACT (Pb, Cu, As…) RECORDED IN RIVER SEDIMENTS : RIO TINTO PREHISTORIC MINES, 2500 BC (SPAIN) Leblanc et al, 1999 (Montpellier University) • Rio Tinto gold mines were already active more than 4500 y ago • Resulting heavy metal contamination has been enormous : Hg100, Pb1500, As50 • Mining is still going on in this region where the geochemical background has been modified since millenia (inheritated pollution) 1930 BP 2 550 BP 3 000 BP 6 000 BP PF33
MAN AND RIVER RELATIONS SUCCESSFULL REMEDIATION OF WATER QUALITY ISSUE • CN natural concentration, CR recommended concentration, CL limit concentration • Solving water quality issues takes at least 20 y and more (e.g. Great Lakes, Leman L., Rhine R.) • Social inertia are cumulated with environmental inertia (e.g. water residence time, particulates transfer) • Many Human impacts and/or water-related structures can be regarded as permanent (e.g. mine tailings, large dams, sewage networks, i.e. lasting 100 to 1000 y)
TYPOLOGIES OF RIVER BASIN MANAGEMENT SRATEGIES FOR WATER QUALITY ILLUSTRATED BY TRENDS IN WATER QUALITYMANAGED ISSUES F SEVERE IMPACT H CN3 • E CL C MODERATE IMPACT B2 CR NEGLIGIBLE IMPACT B1 D CN1 PRISTINE T0 T2 • TIME CN1, CN2, CN3, natural, (CR) recommended and (CL) limit concentrations. T0 = start of environmental pressures (), T2 = environmental impact detection (), T4 = start of environmental measures (), unplanned decrease of environmental pressures (). A1 and A2 : unecessary management, B1 : precaution management, B2 : delayed precaution management, C : maximum impact management, D : total ban, E : delayed pollution regulation, F : laissez-faire, G : unplanned improvement, H : natural pressure remediation, I : unperceived issue, J1 and J2 : natural pressure endurance and natural pressure suffering.
10 to 100 y TYPOLOGIES OF RIVER BASIN MANAGEMENT SRATEGIES FOR WATER QUALITY ILLUSTRATED BY TRENDS IN WATER QUALITYUNMANAGED ISSUES I J2 SEVERE IMPACT CN3 CL MODERATE IMPACT J1 CN2 G CR A2 NEGLIGIBLE IMPACT CN1 A1 PRISTINE T0 T2 • TIME CN1, CN2, CN3, natural, (CR) recommended and (CL) limit concentrations. T0 = start of environmental pressures (), T2 = environmental impact detection (), T4 = start of environmental measures (), unplanned decrease of environmental pressures (). A1 and A2 : unecessary management, B1 : precaution management, B2 : delayed precaution management, C : maximum impact management, D : total ban, E : delayed pollution regulation, F : laissez-faire, G : unplanned improvement, H : natural pressure remediation, I : unperceived issue, J1 and J2 : natural pressure endurance and natural pressure suffering.
FUNCTIONS RISKS USES HUMAN DRIVERS RESOURCES SERVICES CONTINENTAL AQUATIC SYSTEMS EARTH SYSTEM COMPONENTS GLOBAL CHANGE DRIVERS PRESSURES CONTROL CHANGES SOCIETAL RESPONSES EARTH SYSTEM RESPONSE RIVER SYNDROMES • chemical alteration • salinisation • acidification • eutrophication • flow regulation • fragmentation • silting • neoarheism SHORT TERM REACTION LONG TERM REACTION SOCIAL AND ECONOMIC IMPACTS EARTH SYSTEM CHANGES ANTHROPOSPHERE EARTH SYSTEM HUMAN IMPACTS Continental Aquatic Systems shared by the Anthroposphere and the Earth System at the Anthropocene
Meybeck, 2001 Human responses to environmental impacts are usually delayed
SOUTH AMERICA SEVERE IMPACT B ? A2 MODERATE IMPACT D CL A1 C NEGLIGIBLE IMPACT ? CR PRISTINE E CN - 2000 0 1000 1492 1900 1950 1970 2000 anthropocene WORKING HYPOTHESES ON THE EVOLUTION OF WATER QUALITY ISSUES IN THE NEW WORLD (AMERICAS, AFRICAS, SOUTH ASIA, AUSTRALASIA) FOR SOME KEY ISSUES A : metal contamination. B : organic and faecal contamination. C : nitrate pollution. D : organic micropollutants (xenobiotic). E : radionucleids. Accelerated time scale.
CL CR CN WORKING HYPOTHESES ON THE EVOLUTION OF WATER QUALITY ISSUES IN THE OLD WORLD (EUROPE, MEDITERRANEAN BASIN, MIDDLE EAST, EAST ASIA) FOR SOME KEY ISSUES OLD WORLD A SEVERE IMPACT B MODERATE IMPACT E NEGLIGIBLE IMPACT C PRISTINE D - 2000 0 1000 1492 1900 1950 1970 2000 LOCAL IMPACTS REGIONAL GLOBAL anthropocene A : metal contamination. B : organic and faecal contamination. C : nitrate pollution. D : organic micropollutants (xenobiotic). E : radionucleids. Accelerated time scale.
FLUVIAL FILTERING Trajectories of riverine fluxes of contaminants and nutrients during the Holocene and Anthropocene (accelerated time scale) • ANTHROPOCENE • Flux • HOLOCENE • IA Emissions > Retentions • IB • A • IC Emissions = retentions • B • Holocene range • IIC • IIA,B Retentions > Emissions • 2100 • 10 000 • 0 • 1000 • AD • 1700 • 1950 • 2000 • t • and Historical records • Paleo • Surveys • Scenarios