Download
1 / 31
310 likes | 446 Views
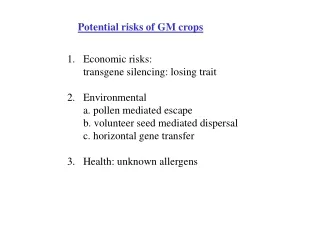
Detecting gene flow from GM crops to wild relatives. Mike Wilkinson. Interspecific hybrids between crops and wild relatives, worldwide. Ellstrand et al. 1999. In the United Kingdom. Of 30 crops reviewed 7 have no cross-compatible wild relatives 11with the potential for hybrid formation

E N D
Detecting gene flow from GM crops to wild relatives Mike Wilkinson
Interspecifichybrids between crops and wild relatives, worldwide Ellstrand et al. 1999
In the United Kingdom Of 30 crops reviewed 7 have no cross-compatible wild relatives 11with the potential for hybrid formation 12 with a history of hybridization From Raybould and Gray, 1993, amended by Wilkinson 2002
In the United Kingdom First wave of GM crops Maize No relatives Oilseed rape Many relatives Sugar beet 1 close relative Potato 3 relatives, none compatible
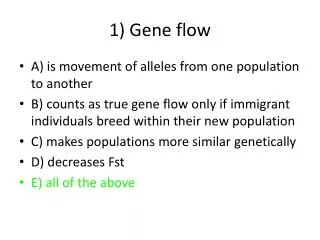
The process of transgene recruitment and spread • Initial Hybridization • Introgression • Gene flow between populations • Changed fitness leading to change in population size, density or distribution • Effects on other organisms • Bilateral interactions(e.g. bitrophic) • Trilateral interactions (Tritrophic) • Changed community
1. Hybrid frequency affects the likelihood of all subsequent consequences
Example Impact GM crop A specialist parasitoid
GM crop F1 hybrid in region Insect resistant transgene stabilises by introgression Transgene spreads to most populations Enhanced resistance to herbivore depresses herbivore numbers Depressed herbivore numbers depress specialist parasitoid abundance
2. Hybrid abundance dictate the value of measures to repress/prevent hybrid formation Isolation distance Male sterility Integration site Chloroplast transformation Inducible promotors/ ‘terminator technology’ Transgene excision
Estimates of hybrid abundance and other exposure terms have most value for regulation when applied at national scale
How do you estimate F1 hybrid formation between crop and wild relatives across the UK? • Identify recipients • Quantify ‘local’ gene flow rates • Estimate long-range gene flow • Combine 1-3 to estimate frequency and location of hybrids
Brassica rapa B. oleracea B. carinata B. juncea B. nigra B. adpressa Raphanus raphanistrum Diplotaxis erucoides D. muralis Possible primary recipientsScheffler & Dale (1994) Transgenic Res. 3, 263-278
Brassica rapa • Casuals of disturbed land • A weed of B. napus • Stable wild populations of river banks
Hybrid seed formation • 9-93% of seeds from B. rapa are hybrids Average 60% Surely lots of hybrids will be everywhere Jorgensen and Andersen (1994)
No, because • B. rapa is an infrequent weed • Crop rotation and weed control
Weedy B.rapa In Yorkshire and the Humber region 37.4% of OSR fields contain weedy rapa In all other regions 0.54% of OSR fields contain weedy rapa
Hybrid survival Hybrid seeds show <10% dormancy Weedy B. rapa shows 60-90% dormancy So in next year, 90% of hybrids germinate but only 10-40% of B. rapa WEED CONTROL IS EFECTIVE IN CEREALS Linder (1998) Ecological Applications 8 (4): 1180-1195
Wild B. rapa Local hybrids Long-range hybrids
Screen seed offspring for hybrids 15341 seeds sown from two populations 8647 seeds germinated 46 hybrids [morphology, flow cytometry, chromosome counts, ISSR] (0.5%) Hambledon (5m separation- 0.4%) Culham (1m separation- 1.5%) Wilkinson et al (2000)
Total hybrid number per annum Weed and wild hybrid numbers are now being calculated with error estimates for the entire UK
Conclusions • The number and distribution of hybrids determine the scale, speed and possibility of any subsequent ecological change • Hybrid numbers in a country determines the feasibility of corrective measures • Error estimates will be fairly large initially but can be improved • Hybrid frequency estimates should be followed by measures of other parts of the pathway to change
Thoughts Quantification of each stage in the pathway to change is possible but requires consideration of location, context and biology of both crop and recipient Quantification requires effort to integrate data from different disciplines Information generated is generic for the crop in the country concerned