Download
1 / 1
10 likes | 163 Views
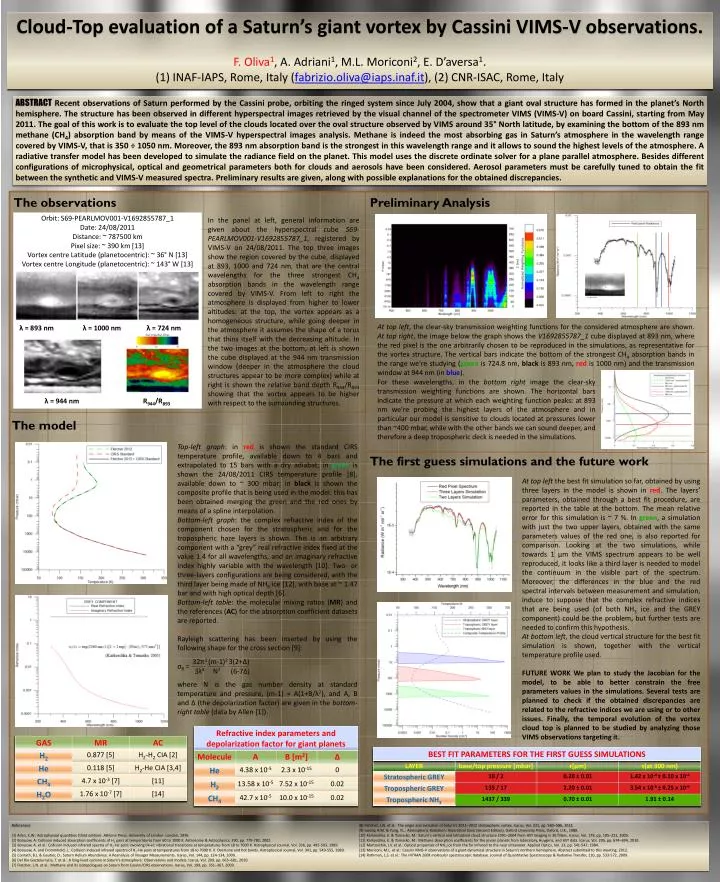
Cloud-Top evaluation of a Saturn’s giant vortex by Cassini VIMS-V observations. F. Oliva 1 , A. Adriani 1 , M.L. Moriconi 2 , E. D’aversa 1 . (1) INAF-IAPS, Rome, Italy ( fabrizio.oliva@iaps.inaf.it ), (2) CNR-ISAC, Rome, Italy.

E N D
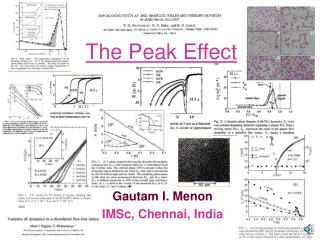
Cloud-Top evaluation of a Saturn’s giant vortex by Cassini VIMS-V observations. • F. Oliva1, A. Adriani1, M.L. Moriconi2, E. D’aversa1. • (1) INAF-IAPS, Rome, Italy (fabrizio.oliva@iaps.inaf.it), (2) CNR-ISAC, Rome, Italy ABSTRACTRecent observations of Saturn performed by the Cassini probe, orbiting the ringed system since July 2004, show that a giant oval structure has formed in the planet’s North hemisphere. The structure has been observed in different hyperspectral images retrieved by the visual channel of the spectrometer VIMS (VIMS-V) on board Cassini, starting from May 2011. The goal of this work is to evaluate the top level of the clouds located over the oval structure observed by VIMS around 35° North latitude, by examining the bottom of the 893 nm methane (CH4) absorption band by means of the VIMS-V hyperspectral images analysis. Methane is indeed the most absorbing gas in Saturn’s atmosphere in the wavelength range covered by VIMS-V, that is 350 ÷ 1050 nm. Moreover, the 893 nm absorption band is the strongest in this wavelength range and it allows to sound the highest levels of the atmosphere. A radiative transfer model has been developed to simulate the radiance field on the planet. This model uses the discrete ordinate solver for a plane parallel atmosphere. Besides different configurations of microphysical, optical and geometrical parameters both for clouds and aerosols have been considered. Aerosol parameters must be carefully tuned to obtain the fit between the synthetic and VIMS-V measured spectra. Preliminary results are given, along with possible explanations for the obtained discrepancies. The observations Preliminary Analysis Orbit: S69-PEARLMOV001-V1692855787_1 Date: 24/08/2011 Distance: ~ 787500 km Pixel size: ~ 390 km [13] VortexcentreLatitude (planetocentric): ~ 36° N [13] VortexcentreLongitude (planetocentric): ~ 143° W [13] λ = 893 nm λ = 1000 nm λ = 724 nm λ = 944 nm R944/R893 In the panel at left, general information are given about the hyperspectral cube S69-PEARLMOV001-V1692855787_1, registered by VIMS-V on 24/08/2011. The top three images show the region covered by the cube, displayed at 893, 1000 and 724 nm, that are the central wavelengths for the three strongest CH4 absorption bands in the wavelength range covered by VIMS-V. From left to right the atmosphere is displayed from higher to lower altitudes: at the top, the vortex appears as a homogeneous structure, while going deeper in the atmosphere it assumes the shape of a torus that thins itself with the decreasing altitude. In the two images at the bottom, at left is shown the cube displayed at the 944 nm transmission window (deeper in the atmosphere the cloud structures appear to be more complex) while at right is shown the relative band depth R944/R893 showing that the vortex appears to be higher with respect to the surrounding structures. λ = 893 nm At top left, the clear-sky transmission weighting functions for the considered atmosphere are shown. At top right, the image below the graph shows the V1692855787_1 cube displayed at 893 nm, where the red pixel is the one arbitrarily chosen to be reproduced in the simulations, as representative for the vortex structure. The vertical bars indicate the bottom of the strongest CH4 absorption bands in the range we’re studying (green is 724.8 nm, black is 893 nm, red is 1000 nm) and the transmission window at 944 nm (in blue). For these wavelengths, in the bottom right image the clear-sky transmission weighting functions are shown. The horizontal bars indicate the pressure at which each weighting function peaks: at 893 nm we’re probing the highest layers of the atmosphere and in particular our model is sensitive to clouds located at pressures lower than ~400 mbar, while with the other bands we can sound deeper, and therefore a deep tropospheric deck is needed in the simulations. The model Top-left graph: in red is shown the standard CIRS temperature profile, available down to 4 bars and extrapolated to 15 bars with a dry adiabat; in green is shown the 24/08/2011 CIRS temperature profile [8], available down to ~ 300 mbar; in black is shown the composite profile that is being used in the model: this has been obtained merging the green and the red ones by means of a spline interpolation. Bottom-left graph: the complex refractive index of the component chosen for the stratospheric and for the tropospheric haze layers is shown. This is an arbitrary component with a “grey” real refractive index fixed at the value 1.4 for all wavelengths, and an imaginary refractive index highly variable with the wavelength [10]. Two- or three-layers configurations are being considered, with the third layer being made of NH3 ice [12], with base at ~ 1.47 bar and with high optical depth [6]. Bottom-left table: the molecular mixing ratios (MR) and the references (AC) for the absorption coefficient datasets are reported. Rayleigh scattering has been inserted by using the following shape for the cross section [9]: σR = where N is the gas number density at standard temperature and pressure, (m-1) = A(1+B/λ2), and A, B and Δ (the depolarization factor) are given in the bottom-righttable (data by Allen [1]). The first guess simulations and the future work At top left the best fit simulation so far, obtained by using three layers in the model is shown in red. The layers’ parameters, obtained through a best fit procedure, are reported in the table at the bottom.The mean relative error for this simulation is ~ 7 %. In green, a simulation with just the two upper layers, obtained with the same parameters values of the red one, is also reported for comparison. Looking at the two simulations, while towards 1 μm the VIMS spectrum appears to be well reproduced, it looks like a third layer is needed to model the continuum in the visible part of the spectrum. Moreover, the differences in the blue and the red spectral intervals between measurement and simulation, induce to suppose that the complex refractive indices that are being used (of both NH3 ice and the GREY component) could be the problem, but further tests are needed to confirm this hypothesis. At bottom left, the cloud vertical structure for the best fit simulation is shown, together with the vertical temperature profile used. FUTURE WORK We plan to study the Jacobian for the model, to be able to better constrain the free parameters values in the simulations. Several tests are planned to check if the obtained discrepancies are related to the refractive indices we are using or to other issues. Finally, the temporal evolution of the vortex cloud top is planned to be studied by analyzing those VIMS observations targeting it. 32π3 (m-1)2 3(2+Δ) 3λ4 N2 (6-7Δ) References: [1] Allen, C.W.: Astrophysicalquantities (thirdedition). Athlone Press, Universityof London. London, 1976. [2] Borysow, A: Collision induced absorption coefficients of H2 pairs at temperatures from 60 to 1000 K. Astronomy & Astrophysics, 390, pp. 779-782, 2002. [3] Borysow, A. et al.: Collision induced infrared spectra of H2-He pairs involving 0↔1 vibrational transitions at temperatures from 18 to 7000 K. Astrophysical Journal, Vol. 336, pp. 495-503, 1989. [4] Borysow, A. and Frommhold, L.: Collision induced infrared spectra of H2-He pairs at temperatures from 18 to 7000 K. II. Overtone and hot bands. Astrophysical Journal, Vol. 341, pp. 549-555, 1989. [5] Conrath, B.J. & Gautier, D.: Saturn Helium Abundance: A Reanalysis of Voyager Measurements. Icarus, Vol. 144, pp. 124-134, 2000. [6] DelRío-Gaztelurrutia, T. et al.: A long-lived cyclone in Saturn’s atmosphere: Observations and models. Icarus, Vol. 209, pp. 665–681, 2010. [7] Fletcher, L.N.et al.: Methane and its isotopologues on Saturn from Cassini/CIRS observations. Icarus, Vol. 199, pp. 351–367, 2009. [8] Fletcher, L.N.et al.: The origin and evolution of Saturn’s 2011–2012 stratospheric vortex. Icarus, Vol. 221, pp. 560–586, 2012. [9] Goody, R.M. & Yung, Y.L.: AtmosphericRadiation: theoreticalbasis (SecondEdition). Oxford University Press, Oxford, U.K., 1989. [10] Karkoschka, E. & Tomasko, M.: Saturn’s vertical and latitudinal cloud structure 1991–2004 from HST imaging in 30 filters. Icarus, Vol. 179, pp. 195–221, 2005. [11] Karkoschka, E. & Tomasko, M.: Methane absorption coefficients for the jovian planets from laboratory, Huygens, and HST data. Icarus, Vol. 205, pp. 674–694, 2010. [12] Martonchik, J.V.et al.: Opticalpropertiesof NH3icefrom the far infrared to the near ultraviolet. Applied Optics, Vol. 23, pp. 541-547, 1984. [13] Moriconi, M.L. et al.: Cassini VIMS-V observations of a giant dynamical structure in Saturn’s northern hemisphere. Abstract submitted to this meeting, 2012. [14] Rothman, L.S. et al.: The HITRAN 2008 molecular spectroscopic database. Journal of Quantitative Spectroscopy & Radiative Transfer, 110, pp. 533-572, 2009.