Download
1 / 5
100 likes | 278 Views
Occurrence Management / Root Cause Analysis. Module 9. Learning Objectives. Upon completion of this lesson you will be able to: Discuss items included in section 10 or 11 of the WHO-SLIPTA Checklist Define Root Cause Analysis

E N D
Learning Objectives Upon completion of this lesson you will be able to: • Discuss items included in section 10 or 11 of the WHO-SLIPTA Checklist • Define Root Cause Analysis • Perform a Root Cause Analysis for a deficiency identified in each participant’s laboratory • Present a summary of the Root Cause Analysis to the large group
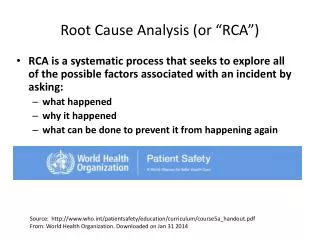
WHO Checklist: Section 10 Occurrence/Incident Management & Corrective Action 10.1 Are laboratory occurrence reports completed, indicating cause analysis performed, and corrective and preventative actions defined and taken on all reports to avoid recurrence? 10.2 Are non-conforming work reviewed and submitted for troubleshooting and cause analysis? 10.3 Is corrective action performed on all non-conforming aspects of the quality management system and is this documented? 10.4 Are discordant results tracked and appropriate corrective action taken?
WHO Checklist: Section 11 Occurrence/Incident Management & Process Improvement 11.1 Are graphical tools (charts & graphs) used to communicate quality findings and identify trends? 11.2 Are quality indicators (TAT, rejected specimens, stock outs, etc.) selected, tracked, and reviewed regularly to monitor laboratory performance and identify potential quality improvement activities? 11.3 Are the outcomes of internal and external audits, PT, customer feedback and all other information derived from the tracking of quality indicators used to improve lab performance?
Small Group Discussion Each group has 30 minutes: • To discuss items 11.1, 11.2, & 11.3 and make a list of what their lab does to meet each item • To discuss and list what obstacles prevent them from meeting each item • Identify a potential improvement project, where they would look for background information, and how they would design the project • Each group will share their responses with the large group and ask for feedback (15 minutes per group)