Download
1 / 20
200 likes | 342 Views
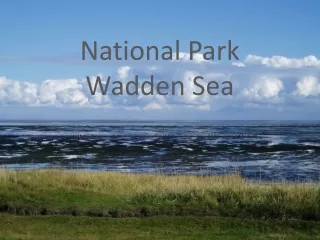
Risk Assessment for the Wadden Sea Pilot study Ribe Dike Progress report of sub-project SP7. Workshop 12 - 13 May 2004, Norden, Germany. Contents. Location of pilot study area (by T. Piontkowitz) Approach (by T. Piontkowitz) Failure probability of the Ribe sea defence (by A. Kortenhaus)

E N D
Risk Assessment for the Wadden Sea Pilot study Ribe Dike Progress report of sub-project SP7 Workshop 12 - 13 May 2004, Norden, Germany
Contents • Location of pilot study area (by T. Piontkowitz) • Approach (by T. Piontkowitz) • Failure probability of the Ribe sea defence (by A. Kortenhaus) • Vulnerability analysis (by T. Piontkowitz) • Questions & discussion
Location of pilot study area • Ribe Dike • length ca. 18,4 km • protected area 6.826 ha • year of construction1911-1914 • 1. reinforcement 1924-1925 • 2. reinforcement (flattening of outer slope) 1978-1980 • 2 sluices (Ribe Å and Konge Å) and 2 smaller outlets
Cross-sections and topography River, stream Wetland Lake Ribe Dike Profile + stationing no. Sluice Salt marsh edge under 0 0,0 - 0,5 m 0,5 - 1,0 m 1,0 - 1,5 m 1,5 - 2,0 m 2,0 - 2,5 m 2,5 - 3,0 m 3,0 - 3,5 m 3,5 - 4,0 m 4,0 - 4,5 m 4,5 - 5,0 m over 5 m (DVR90) • selected from a number of existing cross-sections (former surveys) • 4 cross-sections north of the sharp bend (perpendicular wave direction 250°), 2 cross-sections south of the sharp bend (perpendicular wave direction 290°)
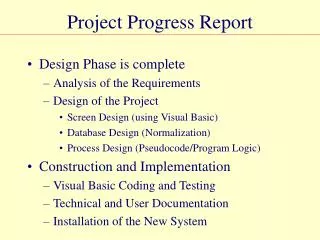
Approach Part 1 Part 2 Failure probability of Ribe dike Vulnerability analysis Part 3 Dike breach scenarios and inundation simulation Risk assessment divided into three parts • include valuation analysis and damage analysis • data collection by DCA • damage models in cooperation with consultants • results: (i) spatial use and material assets over elevation (ii) definition of damage models • based on ProDeich model(cooperation with LWI) • 6 cross-sections • definition of dike breach scenarios • inundation simulation Risk of Ribe sea defence and its hinterland
Vulnerability analysis - risk elements Not Valued Direct Intangible Damage Number of population • Night and day population Vehicles (are normally removed during evacuation) Tourism (tourist on the spot, number of beds) Valued Direct Tangible Damage Buildings Electronic installation • Pumps • High voltage line Economic sector • Crop • Stock • Movable property Household • Movable property Infrastructure • Roads • Railway
Vulnerability analysis – data sources OIS-registry: Public informationregistry BBR-registry: Local registry Containing 128 columns ESR-registry: Land registry SVUR-registry: Registry of valuation for rating PLAN-registry: Registry of town and country planning MATR-registry: Registry of real estate CHR-registry: Registry of livestock population Crop: Meadow of different crops
Topography Salt marsh edge under 0 m DVR90 0,0 - 0,5 m DVR90 0,5 - 1,0 m DVR90 1,0 - 1,5 m DVR90 1,5 - 2,0 m DVR90 2,0 - 2,5 m DVR90 2,5 - 3,0 m DVR90 3,0 - 3,5 m DVR90 3,5 - 4,0 m DVR90 4,0 - 4,5 m DVR90 4,5 - 5,0 m DVR90 over 5 m DVR90
Fresh water discharge Stream Wetland Lake Ribe Dike Profile Lock Salt marsh edge under 0 m DVR90 0,0 - 0,5 m DVR90 0,5 - 1,0 m DVR90 1,0 - 1,5 m DVR90 1,5 - 2,0 m DVR90 2,0 - 2,5 m DVR90 2,5 - 3,0 m DVR90 3,0 - 3,5 m DVR90 3,5 - 4,0 m DVR90 4,0 - 4,5 m DVR90 4,5 - 5,0 m DVR90 over 5 m DVR90
Settlement Building Town centre Greenhouse High settlement Industry Cemetery Low settlement Ribe Dike Salt marsh edge under 0 m DVR90 0,0 - 0,5 m DVR90 0,5 - 1,0 m DVR90 1,0 - 1,5 m DVR90 1,5 - 2,0 m DVR90 2,0 - 2,5 m DVR90 2,5 - 3,0 m DVR90 3,0 - 3,5 m DVR90 3,5 - 4,0 m DVR90 4,0 - 4,5 m DVR90 4,5 - 5,0 m DVR90 over 5 m DVR90
Infrastructure Ribe Dike Tele pylon Pumps Windmill High-voltage line Second road Road over 6 m Road 3-6 m Path Expressway Railway track Technical area Area
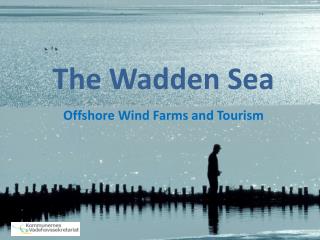
Land use Salt marsh edge Town centre Cemetery Industry Greenhouse High settlement Low settlement Building Ribe Dike Windmill Tele pylon Pumps Roads Technical area Stream Lake Water area Recreation Sports park Moor Trees Wood/Park Farm Land
Crop distribution Salt marsh edge Another winter grain Spring grain Arable pasture grass Permanent grassland Set a-side Forest Winter wheat Non-farm area No information
Valuation analysis - crops Prices per ha Crops
Valuation analysis - crops m DVR90 4,5-5,0 3,5-4,0 3,0-3,5 2,5-3,0 2,0-2,5 1,5-2,0 1,0-1,5 0,5-1,0 0,0-0,5 Below 0 0 5 10 15 20 25 30 35 Values (million Dkr.)
Valuation analysis - buildings m DVR90 4,5-5,0 4,0-4,5 3,5-4,0 3,0-3,5 2,5-3,0 2,0-2,5 1,5-2,0 1,0-1,5 0,5-1,0 0,0-0,5 0 1,0 2,0 3,0 4,0 Property values (1000 million Dkr.)
Damage models 2 examples: 1. Buildings 2. Economic sector - movable property
Buildings (Water level) Compensation for damage(1000 kr.) 1.000 800 600 400 200 0 0 1,0 2,0 3,0 4,0 4,5 Water level out side the building (m)
Economic sector – movable property Compensation for damage (1000 kr.) 1.200 1.000 800 600 400 200 0 0 1,0 2,0 3,0 4,0 5,0 Water level out side the building(m)