Download

1 / 24
240 likes | 341 Views
Application 2: Minnesota Domestic Violence Experiment. Methods of Economic Investigation Lecture 6. Why are we doing this?. Walk through an experiment Design Implementation Analysis Interpretation Compare standard difference in means with “instrumental variables”

E N D
Application 2: Minnesota Domestic Violence Experiment Methods of Economic Investigation Lecture 6
Why are we doing this? • Walk through an experiment • Design • Implementation • Analysis • Interpretation • Compare standard difference in means with “instrumental variables” • Angrist (2006) paper is a very good and easy to understand exposition to this (he’s talking to criminologists…)
Outline • Describe the Experiment • Discuss the Implementation • Discuss the initial estimates • Discuss the IV estimates
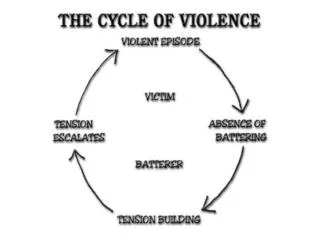
Minnesota Domestic Violence Experiment (MDVE) • Motivated over debate on the deterrence effects of police response to domestic violence • Social experiment to try to resolve debate: • Officers don’t like to arrest (variety of reasons) • Arrest may be very helpful
Experiment Set-up • Call the Police police action • 3 potential responses • Separation for 8 hours • Advice/mediation • Arrest • Randomized which response when to which cases • Only use low-level assaults—not serious, life-threatening ones…
How did they randomize? • Pad of report forms for police officers • Color coded with random ordering of colors • For each new case, get a given response with probability 1/3 independent of previous action • Police need to implement…
What went wrong? Police Compliance • Sometimes arrested when were supposed to do something else • Suspect attacked officer • Victim demanded arrests • Serious injury • Sometimes swapped advice for separation, etc. • Sometimes forgot pad
Nature of Compliance Problem Perfect compliance implies these are 100 Source: Angrist 2006
Where are we? • Experiment intended to randomly assign • Treatment delivered was affected by a behavioral component so it’s endogenous • Treatment determined in part by unobserved features of the situation that’s correlated with the outcome • Example: Really bad guys assigned separation all got arrested • Comparing actual treatment and control will overstate the efficacy of separation
Definition: Intent to Treat (ITT) • Define terms: • Assigned to treatment: T =1 if assigned to be treated, 0 else • Received treatment: R = 1 if treatment delivered, 0 else Ignore compliance and compare individuals on the initial random assignment ITT = E(Y | T=1) – E(Y | T=0)
Putting this in the IV Framework • Simplify a little: • Two behaviors: Arrest or Coddle • Can generalize this to multiple treatments • Outcome variable: Recidivism (Yi) • Outcome for those coddled : Y1i • Outcome for those not coddled (Arrest): Y0i
Observed Recidivism Outcome • Both outcomes exist for everyone BUT we only observe one for any given person • Yi = Y0i(1-Ri)+Y1iRi • Don’t know what an individual would have done, had they not received observed treatment Individuals who were not coddled Individuals who were coddled
What if we just compared differences on outcomes based on treatment? E(Yi |Ri=1) – E(Yi | Ri=0) = E(Y1i |Ri=1) – E(Y0i | Ri=0) = E(Y1i - Y0i |Ri=1) –{E(Y0i | Ri=1) – E(Y0i | Ri=0)} TOT Interpretation: Difference between what happened and what would have happened if subjects had been treated Selection Effect > 0 because treatment delivered was not randomly assigned
Using Randomization as an Instrument • Consequence of non-compliance: relation between potential outcomes and delivered treatment causes bias in treatment effect • Compliance does NOT affect the initial random assignment • Can use this to recover ITT effects
The Regression Framework • Suppose we just have a constant treatment effect Y1i - Y0i = α • Define the mean of the Y0i = β + εi where E(Y0i)= βi • Outcomes: Yi=β + αR i + εi • Restating the problem: R and εare correlated
The Assigned Treatment • Random Assignment means T and εare independent • How can we recover the true TE? • This should look familiar: it’s the Wald Estimator
How do we get this in real life? • First, a bit more notation. Define “potential” delivered treatment assignments so every individual as: R0i and R1i • Notice that one of these is just a hypothetical (since we only observe one actual delivered treatment) R = R0i + Ti (R1i – R0i )
Identifying Assumptions • Conditional Independence: Zi independent of {Y0i , Y1i , R0i , R1i} • Often called “exclusion restriction” • Monotonicity: R1i ≥ R0i or vice versa for all individuals (i) • WLOG: Assume R1i ≥ R0i • In our case: assume that assignment to coddling makes coddling treatment delivered more likely
What do we look for in Real Life? Want to make sure that there is a relationship between assigned treatment and delivered treatment so test: Pr(Coddle-deliveredi) = b0 + b1(Coddle Assignedi) + B’(Other Stuffi) + ei
What did Random Assignment Do? • Random assignment FORCED people to do something but would they have done treatment anyway? • Some would not have but did because of RA: these are the “compliers” with R1i ≥ R0i • Some will do it no matter what: These are the “always takers” R1i = R0i =1 • Some will never do it no matter what: These are the “never takers” R1i = R0i =0
Local Average Treatment Effect • Identifying assumptions mean that we only have variation from 1 group: the compliers • Given identifying assumptions, the Wald estimator consistently identifies LATE LATE = E(Y1i - Y0i |R1i>R0i) • Intuition: Because treatment status of always and never takers is invariant to the assigned treatment: LATE uninformative about these
How to Estimate LATE • Generally we do this with 2-Staged Least squares • We’ll talk about this in a couple weeks • Comparing results in Angrist (2006) • ITT = 0.108 • OLS (TOT + SB) = 0.070 • IV (LATE) = 0.140
What did we learn today • Different kinds of treatment effects • ITT, TOT, LATE • When experiments have problems with compliance, it’s useful have different groups (always-takers, never-takers, compliers) • If your experiment has lots of compliance issues AND you want to estimate LATE—you can use Instrumental Variables (though you don’t know the mechanics how yet!)
Next Time • Thinking about Omitted Variable Bias in a regression context: • Regressions as a Conditional Expectation Function • When can a regression be interpreted as a causal effect • What do we do with “controls”