Download

1 / 51
520 likes | 756 Views
Gene Regulation and Microarrays. Overview. A. Gene Expression and Regulation B. Measuring Gene Expression: Microarrays C. Finding Regulatory Motifs. A. Regulation of Gene Expression. Cells respond to environment. Various external messages. Heat. Responds to environmental conditions.

E N D
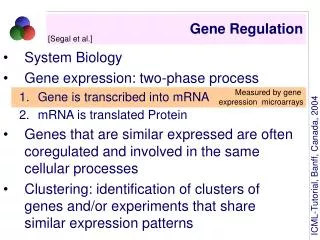
Overview • A. Gene Expression and Regulation • B. Measuring Gene Expression: Microarrays • C. Finding Regulatory Motifs
Cells respond to environment Various external messages Heat Responds to environmental conditions Food Supply
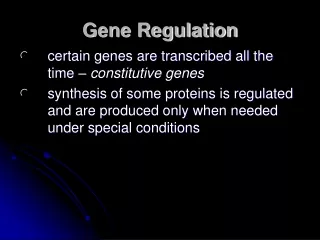
Genome is fixed – Cells are dynamic • A genome is static • Every cell in our body has a copy of same genome • A cell is dynamic • Responds to external conditions • Most cells follow a cell cycle of division • Cells differentiate during development
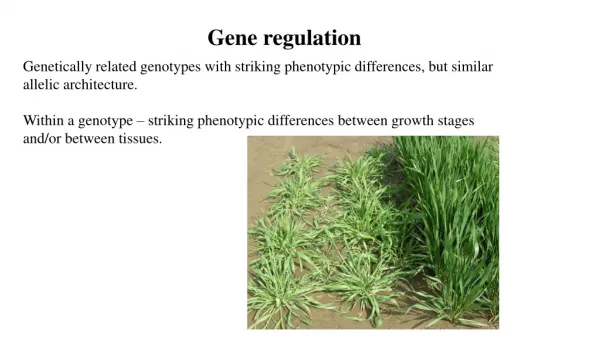
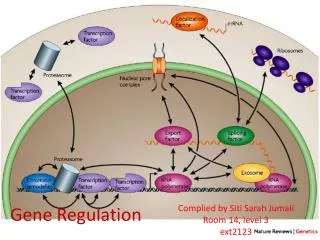
Gene regulation • Gene regulation is responsible for dynamic cell • Gene expression varies according to: • Cell type • Cell cycle • External conditions • Location
Where gene regulation takes place • Opening of chromatin • Transcription • Translation • Protein stability • Protein modifications
Transcriptional Regulation • Strongest regulation happens during transcription • Best place to regulate: No energy wasted making intermediate products • However, slowest response time After a receptor notices a change: • Cascade message to nucleus • Open chromatin & bind transcription factors • Recruit RNA polymerase and transcribe • Splice mRNA and send to cytoplasm • Translate into protein
Transcription Factors Binding to DNA Transcription regulation: Certain transcription factors bind DNA Binding recognizes DNA substrings: Regulatory motifs
Promoter and Enhancers • Promoter necessary to start transcription • Enhancers can affect transcription from afar
Regulation of Genes Transcription Factor (Protein) RNA polymerase (Protein) DNA Gene Regulatory Element
Regulation of Genes Transcription Factor (Protein) RNA polymerase DNA Regulatory Element Gene
Regulation of Genes New protein RNA polymerase Transcription Factor DNA Regulatory Element Gene
Example: A Human heat shock protein --158 0 HSE CCAAT AP2 AP2 CCAAT SP1 SP1 TATA • TATA box: positioning transcription start • TATA, CCAAT: constitutive transcription • GRE: glucocorticoid response • MRE: metal response • HSE: heat shock element GENE promoter of heat shock hsp70
The Cell as a Regulatory Network If C then D gene D • Genes = wires • Motifs = gates A B C Make D If B then NOT D D If A and B then D gene B D C Make B If D then B
B. DNA Microarrays Measuring gene transcription in a high-throughput fashion
What is a microarray (2) • A 2D array of DNA sequences from thousands of genes • Each spot has many copies of same gene • Allow mRNAs from a sample to hybridize • Measure number of hybridizations per spot
How to make a microarray • Method 1: DNA microarray (Stanford) • Use PCR to amplify a 1Kb portion of each gene • Apply each sample on glass slide • Method 2: DNA Chip (Affymetrix) • Grow oligonucleotides (25bp) on glass • Several words per gene (choose unique words) If we know the gene sequences, Can sample all genes in one experiment!
Goal of Microarray Experiments • Measure level of gene expression across many different conditions: • Expression Matrix M: {genes}{conditions}: Mij = |genei| in conditionj • Deduce gene function • Genes with similar function are expressed under similar conditions • Deduce gene regulatory networks – parts and connections-level description of biology
Analysis of Microarray Data • Clustering • Idea: Groups of genes that share similar function have similar expression patterns • Hierarchical clustering • k-means • Bayesian approaches • Projection techniques • Principal Component Analysis • Independent Component Analysis • Classification • Idea: A cell can be in one of several states • (Diseased vs. Healthy, Cancer X vs. Cancer Y vs. Normal) • Can we train an algorithm to use the gene expression patterns to determine which state a cell is in? • Support Vector Machines • Decision Trees • Neural Networks • K-Nearest Neighbors
Hierarchical Agglomerative Clustering Michael Eisen, 1998 • Hierarchical Agglomerative Clustering • Step 1: Similarity score between all pairs of genes • Pearson Correlation • Step 2: Find the two most similar genes, replace with a node that contains the average • Builds a tree of genes • Step 3: Repeat. • Can do the same with experiments
Results of Clustering Gene Expression • CLUSTER is simple and easy to use • De facto standard for microarray analysis Time: O(N2M) N: #genes M: #conditions
K-Means Clustering Algorithm • Randomly initialize k cluster means • Iterate: • Assign each genes to the nearest cluster mean • Recompute cluster means • Stop when clustering converges Notes: • Really fast • Genes are partitioned into clusters • How do we select k?
K-Means Algorithm • Randomly Initialize Clusters
K-Means Algorithm • Assign data points to nearest clusters
K-Means Algorithm • Recalculate Clusters
K-Means Algorithm • Recalculate Clusters
K-Means Algorithm • Repeat
K-Means Algorithm • Repeat
K-Means Algorithm • Repeat … until convergence Time: O(KNM) per iteration N: #genes M: #conditions
Multiple-pass K-Means clustering (A Gasch, MB Eisen 2002) • Each gene can belong to many clusters • Soft (fuzzy) assignment of genes to clusters • Each gene has 1.0 membership units, allocated amongst clusters based on correlation with means • Cluster means are calculated by taking the weighted average of all the genes in the cluster Algorithm: • Use PCA to initialize cluster means • 3 applications of k-means clustering, find k/3 clusters per application • In each application, start with brand new clusters and initializations • And a few more heuristic tricks
Initialization • Use PCA to find a few eigenvectors for initialization • These features capture the directions of maximum variance • Must be orthonormal
Example Initialization • k/3 centroids defined from k/3 first eigenvectors
Example • First application of clustering Objective function to minimize, J(F, V) X genes F assignment of genes to clusters mXV assign. coeff. of gene Xi to cluster Vj dXV distance of gene Xi with centroid Vj
Iteration of the approach • Remove genes that have a Pearson Correlation with a particular cluster greater than .7 • Intuition: These strong signal from these genes has been accounted for • Repeat
Removing Duplicate Centroids • Remove centroids with Pearson correlation > 0.9 • Allows selecting a large initial number of clusters, since duplicates will be removed
Repeat 3 times Output • Cluster means • Gene assignments to clusters
4. Analysis of Clustered Data • Statistical Significance of Clusters • Gene Ontology/ KEGG databases • Regulatory motifs responsible for common expression • Regulatory Networks • Experimental Verification
Finding Regulatory Motifs Given a collection of genes with common expression, Find the TF-binding motif in common . . .
Characteristics of Regulatory Motifs • Tiny • Highly Variable • ~Constant Size • Because a constant-size transcription factor binds • Often repeated • Low-complexity-ish
Sequence Logos • Information at pos’n I, H(i) = – {letter a} Prob(a, i) log2 Prob(a, i) • Height of x at pos’n i, L(a, i) = Prob(a, i) (2 – H(i)) • Examples: • Prob(A, i) = 1; H(i) = 0; L(A, i) = 2 • A: ½; C: ¼; G: ¼; H(i) = 1.5; L(A, i) = ¼; L(not T, i) = ¼
Probabilistic Motif: Mij; 1 i W 1 j 4 Mij = Prob[ letter j, pos i ] Find best M, and positions p1,…, pN in sequences Combinatorial Motif M: m1…mW Some of the mi’s blank Find M that occurs in all si with k differences Problem Definition Given a collection of promoter sequences s1,…, sN of genes with common expression
Essentially a Multiple Local Alignment • Find “best” multiple local alignment Alignment score defined differently in probabilistic/combinatorial cases . . .
Algorithms • Probabilistic • Expectation Maximization: MEME • Gibbs Sampling: AlignACE, BioProspector • Exhaustive CONSENSUS, TEIRESIAS, SP-STAR, MDscan