Download
1 / 13
130 likes | 326 Views
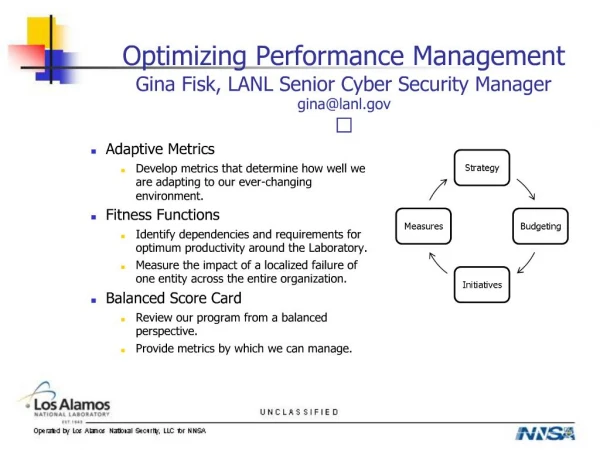
Optimizing Performance Management Gina Fisk, LANL Senior Cyber Security Manager gina@lanl.gov. Adaptive Metrics Develop metrics that determine how well we are adapting to our ever-changing environment. Fitness Functions

E N D
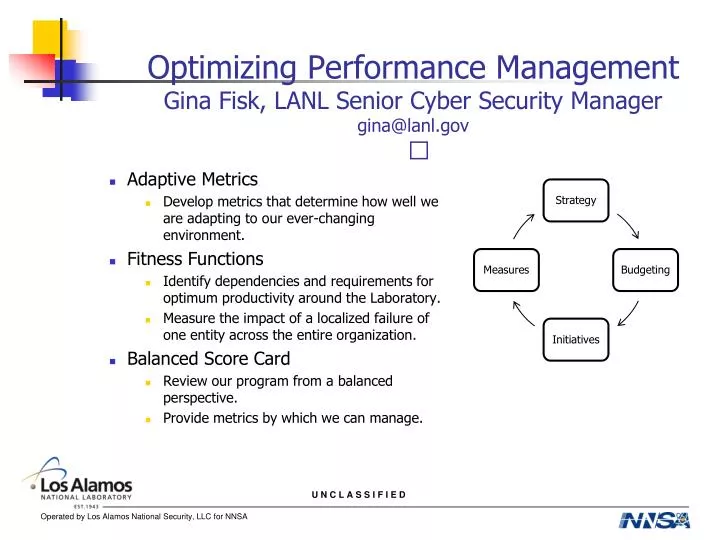
Optimizing Performance ManagementGina Fisk, LANL Senior Cyber Security Managergina@lanl.gov • Adaptive Metrics • Develop metrics that determine how well we are adapting to our ever-changing environment. • Fitness Functions • Identify dependencies and requirements for optimum productivity around the Laboratory. • Measure the impact of a localized failure of one entity across the entire organization. • Balanced Score Card • Review our program from a balanced perspective. • Provide metrics by which we can manage.
Starting Point – Remove the Clutter • Remove metrics that we can’t use to manage our information security program. • How many customers called our help desk. • How many connections were deflected by our firewall. • How many times our network was scanned, etc. • Bin the remaining metrics into the BSC framework for a Phase I BSC. • Financial. • Customer. • Internal Processes. • Learning and Growth.
Determine Impacts of Failure • Conduct IT Impact Analysis • Determine the cost to an organization if various IT services failed for variable lengths of time. • Network, Email, local storage, etc. • Calculate Impact Rating for each IT Service. • 1/n, where n is the average number of days until an organization has lost 100% of productivity. • Calculate the Daily Monetary Impact of the Loss of that IT Service for an organization. • Calculate the overall productivity cost for the Laboratory as a whole based on that loss.
Focus Areas • From IT Impact Analysis results, identify IT Services with largest impacts to productivity. • Loss of Accreditation of systems • Loss of local network access • Loss of Email • Loss of Oracle • Loss of Internet access • Goals that the CIO and CISO had set for the organization in the Strategy Map. • Develop metrics based on these focus areas and develop Phase II of the BSC.
Operational Excellence Competitive Advantage Information Security Strategy Map Maximize mission enablementby balancing risk and value(F1) F2. Maximize operational efficiency F3. Minimize IT enterprise risk F4. Facilitating acquisition of new business through best-in-class IT security execution FINANCIAL PERSPECTIVE Contribution Competency C1. “Understand and consistently deliver what I need” C2. “Keep me out of security and compliance trouble” C3. “Establish a positive reputation which will help me with my customers” C4. “Become a trusted partner by helping me solve my challenging problems” CUSTOMER PERSPECTIVE Achieve Operational Excellence Create and Support Internal Programs and External Partners Deliver Innovative Security Solutions IP1. Streamline compliance program to achieve 100% of scheduled accreditations IP2. Optimize operations to reduce KTLO by 10% per BU IP3. Enhance performance through implementation and management of service agreements IP4. Mature IT governance processes and increase partner participation IP5. Build a structured, transparent and collaborative regulator relationship IP6. Promote transparency and performance through holistic metrics program IP7. Propose and deliver business-enabling information security solutions IP8. Mature IT risk program to drive security, portfolio, and governance decisions IP9. Enhance red network monitoring and vulnerability management INTERNAL AND PROCESS PERSPECTIVE LG1. Attract, develop, and retain highly skilled security professionals LG2. Develop risk-focused and customer-centric culture LG3. Align employee training with strategic initiatives LEARNING AND GROWTH PERSPECTIVE
Balanced Score Card Note: BSC target performance scores are represented here for explanatory purposes only Hits target. Initiative on track Target not defined. No initiative Short of target. Initiative recoverable Failed process. Initiative not recoverable 6
Fitness Functions Patents Publications Contracts Science and Engineering • Fitness functions measure the overall health of an organization by measuring not only performance, but also the performance of those organizations on which we are dependent to achieve our goals. If the performance of one of the dependencies fails, there are ramifications throughout the entire organization. • Using the fitness scores of dependent organizations, we can measure the impact of a localized failure of one entity across the entire organization, providing valuable measurements of the actual cost of security incidents, network outages, etc. • We can trend these scores to evaluate performance at various levels of the organization. Production Cycles Backups and Storage Visualization Services Reliant Organizations Scientific Computing Network Services Identity Management System Administration Dependencies Core Services Security Infrastructure C&A Physical Infrastructure 7
Example Fitness Function Framework • Fiscal Responsibility (weight: 20%) • Milestones and deliverables (quality, timeliness) • Expenditures (percentage over budget) • Customer Productivity (weight: 15%) • Services maximize productivity around organization (uptime, etc) • Customer Orientation (weight: 15%) • Responsiveness to the customer (SLAs, etc) • Improving Security (weight: 15%) • Progress made toward improving security against our current threat environment (hardening tools, etc) • Institutional Responsibilities (Weight: 20%) • PBI deliverables and reporting (quality, timeliness) • CAP deliverables and reporting (quality, timeliness) • Metrics reporting (quality, accuracy) • Goal-Based Initiatives (weight: 10%) • Progress made against organizational goals.
Fitness Function Example Note: Fitness scores are represented here for explanatory purposes only • Fiscal Responsibility (weight: 20%) .89 • Timeliness of deliverables and milestones: .83 • % of projects +/- 10% of budget allocation: .95 • Laboratory Productivity (weight: 15%) .98 • Uptime of service: .98 • Customer Orientation (weight: 15%) .89 • Customer Satisfaction Rating .89 • Improving Security (weight: 15%) ** .56** • Progress made toward improving security against our current threat environment (hardening tools, etc) .56 • Institutional Responsibilities (Weight: 25%) .68 • PBI deliverables and reporting (quality, timeliness) .90 • CAP deliverables and reporting (quality, timeliness) .75 • Metrics reporting (quality, accuracy) .40 • Goal-Based Initiatives (weight: 10%) .98 • Progress made against initiatives. .98 • FITNESS SCORE: .806
Fitness Score Trends • Fitness scores allow us to watch for trends and to manage by our metrics. • See how major changes affect our performance from month to month. • Change in Management • Change of Platform • Change of Vendor, etc.
Adaptive Metrics • IT Impact Analysis provide us with costs of the failures of IT Services. • We have the data on our ever changing threat environment. • The fitness functions allow us include “moving target” metrics, which change each month, to measure our performance against our current threat environment.
**Adaptive Metric Example Note: Threats and budgets represented here for explanatory purposes only • “Improving Security (weight: 15%)” • Identify top threats for the month. • Phishing, Windows vulnerability, Oracle vulnerability. • Calculate cost of failure of these services across the organization per month. • Email: $200K, Windows: $500K, Oracle: 800K • Overall Budget: 10% in jeopardy • Review % of security effort we are placing on these areas ($$$ spent). • Email: 5%, Windows: 31%, Oracle: 20% • Weight the fitness function by how responsive we are to these areas. • 56% of our budget is spent on our top threat areas.
Managing by the Metrics • Our budget, metrics, and initiatives are actionable and directly tied to our goals. • Our use of the Balanced Score Card helps us ensure uniform management of our business. • Our use of the Fitness Functions help us trend our metrics effectively and monitor the major changes. • We can trend our components individually or as a whole, organizationally or institutionally. • Our use of Adaptive Metrics keep our outlook fresh and defendable.