Download
1 / 20
200 likes | 363 Views
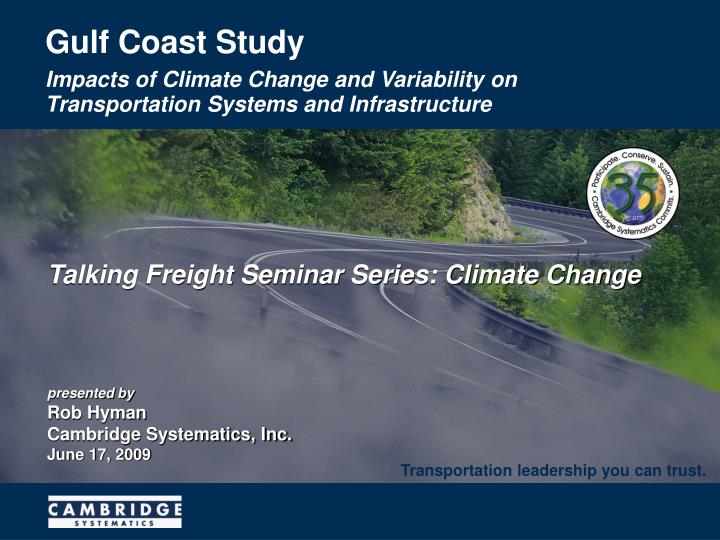
Gulf Coast Study. Impacts of Climate Change and Variability on Transportation Systems and Infrastructure. Talking Freight Seminar Series: Climate Change presented by Rob Hyman Cambridge Systematics, Inc. June 17, 2009. Transportation leadership you can trust. Why Study Impacts and Adaptation?.

E N D
Gulf Coast Study Impacts of Climate Change and Variability on Transportation Systems and Infrastructure • Talking Freight Seminar Series: Climate Change • presented byRob HymanCambridge Systematics, Inc.June 17, 2009 Transportation leadership you can trust.
Why Study Impacts and Adaptation? • Transportation infrastructure is built for the long haul • As climate changes, our infrastructure may need to evolve to handle new conditions • Each region has unique transportation assets and vulnerabilities • Little research has been done on transportation impacts Bonner Bridge Alaska Highway
U.S. DOT / USGS Gulf Coast StudyPotential Impacts of Climate Change and Variabilityon Transportation Systems and Infrastructure
Why Study the Gulf Coast? Nationally significant intermodal network
Accelerated relative sea level rise Increased storm surgeand storm intensity Changes in temperature Changes in precipitation Overall Climate Impacts - Key Drivers for Analysis
Climate ProjectionsTemperature and Precipitation • Average temperature is likely to increase by 1 - 5 °F over the next 50 years • More hot days: # of days > 90 °F may increase by 50% • Extreme daily high temps will also increase – greater than 50% chance of 21 days annually exceeding 100 °F • Models show mixed results for changes in average precipitation • Intensity of rainfall events, however, will likely increase
Climate ProjectionsRelative Sea Level Rise and Storm Intensity • Relative sea level will likely increase 1 to 6 feet • Massive inundation due to relative sea level rise • Relative sea level includes: • Climate-induced impacts of thermal expansion and ice melt; and • Sinking land masses (subsidence) in the central Gulf Coast • Hurricane vulnerability is high today and may worsen • Increase in storm intensity is likely Sea surface temperature trend in the Gulf of Mexico region (Source: Smith and Reynolds 2004)
Highways and transit Rail Ports and waterways Airports Pipelines Emergency management Long-range planning and investment Implications for…
Highways Vulnerable to Relative Sea Level Rise Baseline (Present Day) 4 Feet of Sea Level Rise Source: Cambridge Systematics analysis of U.S. DOT Data.
Freight Handling Ports Facilities Potentially Vulnerable to Relative Sea Level Rise
Vulnerability Due to Relative Sea Level Rise Results • Relative sea level rise (due to climate change and subsidence) of 4 feet could permanently flood: • 24% of interstate miles, 28% of arterial miles, New Orleans transit systems • More than 2,400 miles of roadway are at risk of permanent flooding • 72% of freight / 73% of non-freight facilities at ports • Changes in navigable water levels, lock/dam structures • Loss of landside connections, markets, workforce, etc. • 9% of the rail miles operated, 20% of the freight facilities • 3 airports • Temporary flooding in low-lying areas due to increased heavy downpours will broaden affected areas
Hurricane Vulnerability Source: NASA Remote Sensing Tutorial.
Freight Rail Lines Vulnerable to Storm Surge of 18 feet Source: Cambridge Systematics analysis of climate projections and Federal Railroad Administration data.
Vulnerability Due to Storm Surge Results • Transportation infrastructure that is vulnerable to 18 feet of storm surge includes: • 51% of interstate miles, 56% of arterial miles • 98% of port facilities vulnerable to surge and 100% to wind • 33% of rail miles operated, 43% of freight facilities • 22 airports in the study area at or below 18 feet MSL • Potentially significant damage to offshore facilities
Vulnerability Due to Temperature and Precipitation Changes Results • Temperatures increases: • Potential change in maintenance and construction practices • Increased energy consumption for refrigerated storage • Potential rise in rail buckling • May result in impacts to aircraft performance and runway utilization • Changes in local, regional and national markets and travel demand • Precipitation and run-off changes: • Changes in size of stormwater retention / treatment facilities
What Are The Implications for Transportation Planning? Climate Impacts Engineering and Design Construction In Service Facility Service Life Transp. Planning Process ProjectConcept AdoptedLong-Range Plan 0 10 20 30 40 50 60 70 80 90 100 Years • Climate change is rarely considered today, but the longevity of infrastructure argues for its integration • Current practice focusing on a 20-year time frame is not well-suited to the assessment of climate impacts
How Can We Prepare for Change? • The future is uncertain • So, to have robust transportation systems we need reliability under a range of conditions • Use of new approaches to decision-making • Scenario planning • Probabilistic rather than deterministic approach • Consider both incremental and abrupt change • Integration of climate change with other regional dynamics
Need A Risk Assessment Approach to Transportation Decisions… Risk Assessment AdaptationResponse • Accomodate • Protect • Redundancy • Retreat • Exposure • Vulnerability • Resilience GreaterResilience
But Need More Than Just Degree of Risk to Prioritize Investments… Highest Priority:High Risk / Critical Importance High Risk / Low Importance Exposure and Vulnerability Low Risk / Low Importance Low Risk / CriticalImportance Importance of System/Facility Performance
For More Information… • “The Potential Impacts of Climate Change and Variability on Transportation Systems and Infrastructure –The Gulf Coast Study, Phase I”Synthesis and Assessment Product 4.7http://www.climatescience.gov/Library/sap/sap4-7/final-report/ • Climate Change Science Program http://climatescience.gov/ • DOT Center for Climate Change and Environmental Forecasting http://www.climate.dot.gov/ • rhyman@camsys.com(301) 347-9133