Download
1 / 18
180 likes | 738 Views
Chapter 7 TN Waiting Line Management. Waiting line characteristics Some waiting line management tips Examples (Models 1, 2, 3, and 4). 2. Suggestions for Managing Queues. Do not overlook the effects of perceptions management. Determine the acceptable waiting time for your customers.

E N D
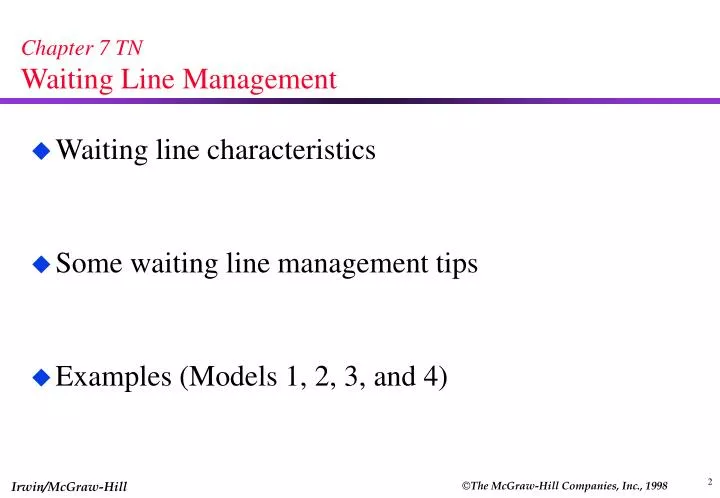
Chapter 7 TNWaiting Line Management • Waiting line characteristics • Some waiting line management tips • Examples (Models 1, 2, 3, and 4) 2
Suggestions for Managing Queues • Do not overlook the effects of perceptions management. • Determine the acceptable waiting time for your customers. • Install distractions that entertain and physically involve the customer. • Get customers out of line. • Only make people conscious of time if they grossly overestimate waiting times. 8
Suggestions for Managing Queues • Modify customer arrival behavior. • Keep resources not serving customers out of sight. • Segment customers by personality types. • Adopt a long-term perspective. • Never underestimate the power of a friendly server. 9
Servicing System Servers Waiting Line Customer Arrivals Exit Components of the Queuing Phenomenon 3
Finite Infinite Population Sources Population Source 4
Constant Variable Service Rate Service Rate 5
One-person barber shop Car wash Bank tellers’ windows Hospital admissions Line Structures Single Phase Multiphase Single Channel Multichannel 6
BALK RENEG Degree of Patience No Way! No Way! 7
Waiting Line Models Source Model Layout Population Service Pattern 1 Single channel Infinite Exponential 2 Single channel Infinite Constant 3 Multichannel Infinite Exponential 4 Single or Multi Finite Exponential These four models share the following characteristics: Single phase · Poisson arrival · FCFS · Unlimited queue length · 10
Example: Model 1 Drive-up window at a fast food restaurant. Customers arrive at the rate of 25 per hour. The employee can serve one customer every two minutes. Assume Poisson arrival and exponential service rates. A) What is the average utilization of the employee? B) What is the average number of customers in line? C) What is the average number of customers in the system? D) What is the average waiting time in line? E) What is the average waiting time in the system? F) What is the probability that exactly two cars will be waiting in line? 11
Example: Model 1 A) What is the average utilization of the employee? 12
Example: Model 1 B) What is the average number of customers in line? C) What is the average number of customers in the system? 13
Example: Model 1 D) What is the average waiting time in line? E) What is the average waiting time in the system? 14
Example: Model 1 F) What is the probability that exactly two cars will be waiting in line? 15
Example: Model 2 An automated pizza vending machine heats and dispenses a slice of pizza in 4 minutes. Customers arrive at a rate of one every 6 minutes with the arrival rate exhibiting a Poisson distribution. Determine: A) The average number of customers in line. B) The average total waiting time in the system. 16
Example: Model 2 A) The average number of customers in line. B) The average total waiting time in the system. 17
Example: Model 3 Recall the Model 1 example: Drive-up window at a fast food restaurant. Customers arrive at the rate of 25 per hour. The employee can serve one customer every two minutes. Assume Poisson arrival and exponential service rates. If an identical window (and an identically trained server) were added, what would the effects be on the average number of cars in the system and the total time customers wait before being served? 18
Example: Model 3 Average number of cars in the system Total time customers wait before being served 19