Download

1 / 20
200 likes | 265 Views
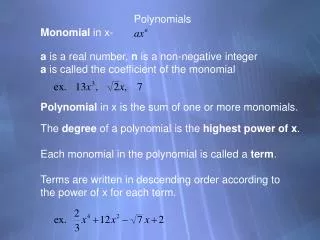
The DEGREE of a polynomial is the largest degree of any single term in the polynomial (Polynomials are often written in descending order of the degree of its terms) COEFFICIENTS are the numerical value of each term in the polynomial

E N D
The DEGREE of a polynomial is the largest degree of any single term in the polynomial (Polynomials are often written in descending order of the degree of its terms) COEFFICIENTS are the numerical value of each term in the polynomial The LEADING COEFFICIENTis the numerical value of the term with the HIGHEST DEGREE. POLYNOMIALS REVIEW
Polynomials Review Practice For each polynomial Write the polynomial in descending order Identify the DEGREE and LEADING COEFFICIENT of the polynomial
Evaluating a Polynomial: Substitute values of x into polynomial and simplify: Find each value for 1. 2. 3. 4.
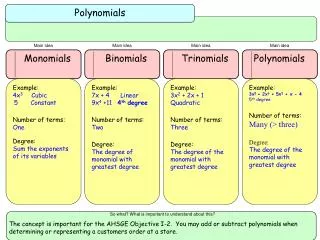
Graphs of Polynomial Functions: Constant Linear Quadratic (degree = 0) (degree = 1) (degree = 2) Cubic Quartic Quintic (deg. = 3) (deg. = 4) (deg. = 5)
OBSERVATIONS of Polynomial Graphs: • DEGREE and ROOT (x-intercept or Zero) Observations: • How does the degree of a polynomial function relate the number of roots (zeroes) of the graph? • 2) DEGREE and SHAPE OBSERVATIONS • How EVEN versus ODD degree graphs start and end? • How are the number of direction changes (up, down) related to the degree?
LEADING COEFFICIENT AFFECTS SHAPE Numerical Value of Degree Describe possible shape of the following based on the degree and leading coefficient:How does the graph start and end? How many changes in direction? POSITIVE Leading Coefficient: NEGATIVE Leading Coefficient
Degree Practice with Polynomial Functions • Identify the degree as odd or even and state possible degree value. • Identify leading coefficient as positive or negative. Degree: Odd or Even Possible Value: ________ LC: Pos or Neg
Draw a graph for each descriptions: Description #3: Degree = 3 Leading Coefficient = 1 Description #1: Degree = 4 Leading Coefficient = 2 Description #2: Degree = 6 Leading Coefficient = -3 Description #4: Degree = 8 Leading Coefficient = -2 Description #5: Degree = 5 Leading Coefficient = -4
RANGE of POLYNOMIAL FUNCTIONSDescribes the possible y-values of the function.Is there a highest or lowest value? EVEN DEGREE ODD DEGREE (-6, 15) (8, 11) (-2, 5) (3, -9) (1, -8)
Graphs # 1 – 6 Identify RANGE:Inequality Notation Graph #3 Graph #2 Graph #1 (-2, 8) (0, 11) (13, 9) (1, 4) (7, -2) (-17, -10) (-6, -9) (-5, -9) (4, -15) Graph #6 Graph #5 Graph #4 (-5,17) (-3,12) (6, 11) (1, 12) (-3, 3) (4, 8) (2, 2) (-2, 6) (3, 2) (1, -3) (-5, -4) (1, -9) (4, -5)
The END BEHAVIOR of a polynomialdescribes the RANGE, f(x), as the DOMAIN, x, moves LEFT(as x approaches negative infinity: x → - ∞) and RIGHT(as x approaches positive infinity : x → ∞) on the graph.Another way of saying it starts and ends going UP or DOWNDetermine the end behavior for each of the given graphs Negative: “Down” Right: “Ends” Decreasing to the Left Decreasing to the Right Left: “Starts” Negative: “Down”
END BEHAVIOR of a polynomial: Continued Right: “Ends” Positive: “Up” Decreasing to the Right Increasing to the Left Negative: “Down” Left: “Starts” Use Range Graphs #1 – 2 • Describe the END BEHAVIOR of each graph • Identify if the degree is EVEN or ODD for the graph • Identify if the leading coefficient is POSITIVE or NEGATIVE GRAPH #2 GRAPH #1 Degree: ODD or EVEN LC:POS or NEG
Use Range Graphs #3 – 6 • Describe the END BEHAVIOR of each graph • Identify if the degree is EVEN or ODD for the graph • Identify if the leading coefficient is POSITIVE or NEGATIVE GRAPH #4 GRAPH #3 GRAPH #6 GRAPH #5
Describing Polynomial Graphs Based on the Equation • Based on the given polynomial function: • Identify the Leading Coefficient and Degree. • Sketch possible graph (Hint: How many direction changes possible?) • Identify the END BEHAVIOR Degree: Odd or Even Leading Coefficient:Pos or Neg END BEHAVIOR Degree: Odd or Even Leading Coefficient:Pos or Neg END BEHAVIOR
Degree: Odd or Even Leading Coefficient:Pos or Neg END BEHAVIOR Degree: Odd or Even Leading Coefficient:Pos or Neg END BEHAVIOR
Degree: Odd or Even Leading Coefficient:Pos or Neg END BEHAVIOR Degree: Odd or Even Leading Coefficient:Pos or Neg END BEHAVIOR
EXTREMA: MAXIMUM and MINIMUM points are the highest and lowest points on the graph. C • Point A is a Relative Maximumbecause it is the highest point in the immediate area (not the highest point on the entire graph). • Point B is a Relative Minimumbecause it is the lowest point in the immediate area (not the lowest point on the entire graph). • Point C is the Absolute Maximumbecause it is the highest point on the entire graph. • There is no Absolute Minimumon this graph because the end behavior is: (there is no bottom point) A B
Identify ALL Maximum or Minimum PointsDistinguish if each is RELATIVE or ABSOLUTE Graph #1 Graph #2 (1, 4) (-2, 8) (-5, -9) (-6, -9) (4, -15) Graph #3 Graph #4 (0, 11) (13, 9) (-3, 3) (2, 2) (7, -2) (1, -3) (-17, -10) (-5, -4) (4, -5)
Identify ALL Maximum or Minimum PointsDistinguish if each is RELATIVE or ABSOLUTE Graph #5 Graph #6 (-3,12) (6, 11) (-2, 22) (6, 3) (1, -9) Graph #7 Graph #8 (-4,19) (-7, 1.3) (10, -4.5) (-7.5, 6) (-17, -1.1) (1, -27) (8, -2.5)
CALCULATOR COMMANDS for POLYNOMIAL FUNCTIONS The WINDOW needs to be large enough to see graph! • The ZEROES/ ROOTS of a polynomial function are the x-intercepts of the graph. Input [ Y=] as Y1 = function and Y2 = 0 [2nd ] [Calc] [Intersect] • To find EXTEREMA(maximums and minimums): Input [ Y=] as Y1 = function [2nd ][Calc] [3: Min] or [4: Max] • LEFT and RIGHT bound tells the calculator where on the domain to search for the min or max. • y-value of the point is the min/max value.