Download
1 / 21
210 likes | 459 Views
Use of Matlab for Analysis and Plotting of Accoustic Well Data. Home. Start Matlab M-files. Program Exercise. Operators and comands. Introduction. Resources. Open and converting data. Quiz. Handling graphics. Introduction.

E N D
Use of Matlab for Analysis and Plotting of Accoustic Well Data
Home Start Matlab M-files Program Exercise Operators and comands Introduction Resources Open and converting data Quiz Handling graphics
Introduction MATLAB is a high-performance language for technical computing. It integrates computation, visualization, and programming in an easy-to-use environment where problems and solutions are expressed in familiar mathematical notation MATLAB is an interactive, matrix based system whose basic data element is an array that does not require dimensioning. This allows you to solve many technical computing problems, especially those with matrix and vector formulations, in a fraction of the time it would take to write a program in a scalar non interactive language such as C or Fortran However, the speed when running a Matlab script or function may be described as ”slow as a turtle” compared to Fortran (”fast as a rabbit”) The name MATLAB stands for MATrix LABoratory. Matlab may … More
Introduction MATLAB may be used directly from the command window, but you should use m-file programming. This is quite similar to Fortran programming but the file is denoted .m rather than .f There are two types of m-files; scripts and functions, where the first is the simplest and easiest-to-use. When you invoke a script, MATLAB simply executes the commands found in the file. Scripts can operate on existing data in the workspace, or they can create new data on which to operate. In addition, scripts can produce graphical output using functions like plot.
Start Matlab There are two ways you can start Matlab: • In Windows from your Start Menu • In Unix, logged on Petra, simply write matlab in the terminal window Creating m-files in: • Windows: when you have started matlab, click file-> new-> m-file • Unix: use a text editor, emacs is preferred (type emacs file.m) Running m-files: type the name of the file (without .m; if the filename is test.m, type test) in the matlab command window and hit enter (both Windows and Unix)
Open and Controlling Data When you have created an m-file, you should start your script by opening the file from which your data is to be imported For a file in ASCII format use the following command: fp = fopen( ’c33.dat’ , ’ r ’) opens the file c33.dat and labels it fp For control of your data you should convert it into a matrix To do so, you should use the command [w,c] = fscanf(fp,'%e %e %e %e %e %e %e %e',[8, inf]) reads data from fp in e-format (%e) into the matrix w that has 8 columns and unknown number of rows (8, inf)
Operators Arithmethic operators in matlab are the familiar expressions: + - / * ^ Note: If you want to perform an element by element operation of two or more matrices, instead of / * ^, use ./ .* .^ If you want to extract the first column from a matrix x and store it as the variable v, use the following command: z = x(1,:) If you want to make a new vector acimp(i)=vp(i)*rho(i), use: acimp = vp.*rho where vp and rho has already been defined
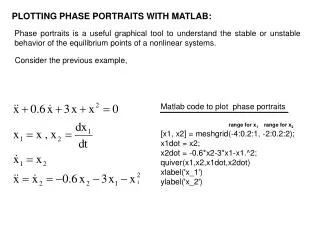
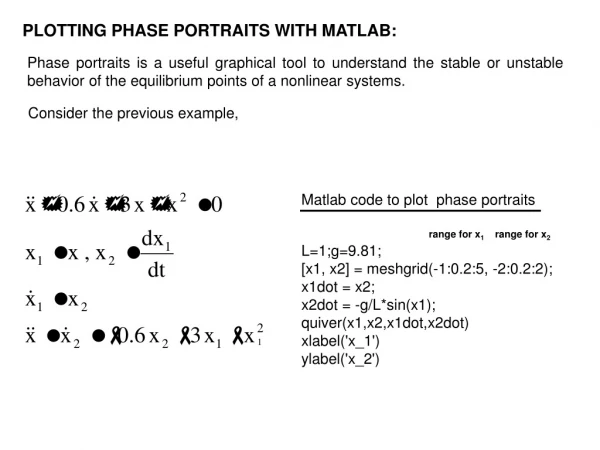
Handling Graphics MATLAB has extensive facilities for displaying vectors and matrices as graphs, as well as annotating and printing these graphs Creating a plot: plot(x, y) produces a graph of y vs x Multiple graphs in one figure: plot(x1, y1, x2, y2, ...) Typically, you often want to plot several different plots in different windows for easy comparison. To do so use the command: figure(n) where n is the number of the figure Colors and Styles Subplots
Colors and Styles It is possible to specify color, linestyle, and markers, such as plus signs or circles, with: plot(x,y,'color_style_marker') Color strings are 'c', 'm', 'y', 'r', 'g', 'b', 'w', and 'k'. These correspond to cyan, magenta, yellow, red, green, blue, white, and black. Linestyle strings are '-' for solid, '- -' for dashed, ':' for dotted, '-.' for dash-dot, and 'none' for no line. The most common marker types include '+', 'o', '*', and 'x'. Plot(x,y,’c:+’) plots a cyan, dotted line and places plus sign markers at each data point
Subplots The subplot function allows you to display multiple plots in the same window: subplot(m,n,p) breaks the figure window into an m-by-n matrix of small subplots and selects the p’th subplot for the current plot. Subplots are best illustraded with an example Example
Program Exercise • In this exercise we will be using accoustic well logs from well C-33 in the Gullfaks field. This well is one of few wells on Gullfaks that has also been logged some distance above the actual reservoir. In addition, shear wave velocities has also been logged. • The file c33.dat (can be downloadedfrom the course homepage), contains the following data: • Column 1: Depth in meters • Column 2: P-wave velocity (m/s) • Column 3: Density, r, (g/ccm) • Column 4: P-wave velocity for 10% water saturation • Column 5: Density, r, for 10% water saturation • Column 6 :P-wave velocity for 80% water saturation • Column 7 :Density, r, for 80% water saturation • Column 8 :S-wave velocity (m/s) Next
Program Exercise • Use MATLAB to read all data from c33.dat to a matrice with 8 columns. Plot Vp , Vs and r as a function of depth. Plot the three curves below each other. • Use MATLAB to compute accoustic impedance (Vp* r) and shear wave accoustic impedance (Vs* r), and plot the two impedances either in the same plot or in to equal plots right below each other. This way, a comparison between the two curves can easily be made. • Compute the Vp/Vs ratio. Comment the deflections around top Kritt (ca 1675 m) and top Brent (1835 m). Also compute the difference in p-wave velocity between 10% and 80% water saturation as a function of depth.
Program Exercise • In seismic AVO-analysis and inversion it is common to use Elastic Impedance. Elastic Impedance (EI) is defined as • where • Compute Elastic Impedance as a function of depth and make a plot where you plot both accoustic impedance and elastic impedance (vs depth). Assume that q is 30 degrees. Comment the difference between the two curves, again particularlyaround top Kritt and top Brent Useful Info Resources
Resources • The whole exercise in a printable format here • Web sites: • http://www.stud.ntnu.no/info/programmer/matte/matlab/matlab-info.html • http://www.ntnu.no/itea.info/programvare/matlabdoc/rel11doc/techdoc/basics/getstarted.html • Short list of MATLAB Commands Useful Info
Useful Info • If you simply type a statement and press Return or Enter, MATLAB automatically displays the results on screen. However, if you end the line with a semicolon, MATLAB performs the computation but does not display any output. This is particularly useful when you generate large matrices. For example • A = magic(100); • As long as you do not want a computation to be shown on the screen, you should always include a semicolon at the end of each line Resources
Quiz • This section includes a quiz on the topics covered by this module. • The quiz is meant as a control to see if you have learned some of the most important features • Hit object to start quiz • (Depending on your connection, this may take a few seconds...)
General information About the author
FAQ • No questions have been posted yet. However, when questions are asked they will be posted here. • Remember, if something is unclear to you, it is a good chance that there are more people that have the same question For more general questions and definitions try these Dataleksikon Webopedia Schlumberger Oilfield Glossary
References ”Getting started with Matlab” http://www.ntnu.no/itea.info/programvare/matlabdoc/rel11doc/techdoc/basics/getstarted.html
Summary Subsequent to this module you should... • be familiar with Matlab and how to use it to visualize computed data • know how to use scripts in Matlab
Example See the plots this matlab script would produce: Figure 1 Figure 2 Back