Download
1 / 59
1.39k likes | 3.17k Views
ERRORS IN EPIDEMIOLOGICAL STUDIES. Assoc. Prof. Pratap Singhasivanon Department of Tropical Hygiene. Page 2. ERROR. Is defined as a false or mistaken result obtained in a study or experiment. Consists of 2 components Systematic error Random error. Page 3. RANDOM ERROR.

E N D
ERRORS IN EPIDEMIOLOGICAL STUDIES Assoc. Prof. Pratap Singhasivanon Department of Tropical Hygiene
Page 2 ERROR Is defined as a false or mistaken result obtained in a study or experiment Consists of 2 components Systematic error Random error
Page 3 RANDOM ERROR Refers to fluctuations around a true value because of Sampling variability SYSTEMATIC ERROR Any difference between the true value and that actually obtained that is the result of all causes other than Sampling variability.
= + SYSTEMATIC ERROR RANDOM ERROR ERROR Fluctuation of and estimate around the population value (RANDOM VARIABILITY) A false or mistaken result obtained in a study or experiment BIAS Error due to factorsthat inherent in the design, conduct and analysis Result obtained in sample differs from result that would be obtained if the entire population were studies Page 4
Page 5 SOURCES AND TYPES OF MEASUREMENT ERROR Sources of Error Researchers Administering The measure Observers Subjects Bias Random Bias Random Bias Random
Page 6 SYSTEMATIC ERROR : SELECTION BIAS INFORMATION BIAS CONFOUNDING
Page 7 RANDOM ERROR Is the divergence, due to chance alone, of an observation on an sample from the true population value
Page 8 Different combinations of high and low reliability and validity Low High VALIDITY High High RELIABILITY Low Low
Page 9 Internal and External Validity External Population Target Population INT. EXT. Study Sample VALIDITY
B A FREQUENCY D C Page 10 VALIDITY AND RELIABILITY VALIDITY HIGH LOW HIGH RELIABILITY LOW
Page 11 VALIDITY : A study is valid if its results corresponds to the truth, no systematic error or should be as small as possible
Page 12 VALIDITY Is the expression of the degree to which a test is capable of measuring what it is intended to measure A study is valid if its results corresponds to the truth, no systematic error and random error should be as small as possible
Page 13 RELATION SHIP BETWEEN BIAS AND CHANCE TRUE BLOOD PRESSURE (INTRA-ARTERIAL CANULA) BLOOD PRESSURE MEASUREMENT (SPHYGMOMANOMETER) NO. OF OBSERVATION CHANCE BIAS 80 90 DIASTOLIC BLOOD PRESSURE (mmHg)
Page 14 SOURCES OF VARIATION CONDITIONS OF DISTRIBUTION OF SOURCE OF MEASUREMENT MEASUREMENT VARIATION One Patient, One Observer Repeated observations MEASUREMENT One Patient, Many Observer, At one time One Patient, One observer, Many Times of Day BIOLOGIC + MEASUREMENT Many Patients
Page 15 FRAMEWORK FOR THE INTERPRETATION OF AN EPIDEMIOLOGIC STUDY IS THERE A VALID STATISTICAL ASSOCIATION? Is the association likely to be due chance? Is the association likely to be due bias? Is the association likely to be due confounding? CAN THIS VALID STATISTICAL ASSOCIATION BE JUDGED AS CAUSE AND EFFECT? Is there a strong association? Is there biologic credibility to the hypothesis? Is there consistency with other studies? Is the time sequence compatible? Is there evidence of a dose-response relationship?
Page 16 Precision : Is the quality of being sharply defined through exact detail. The repeated assay of a single test specimen typically gives rise to a set of results that differ to a greater or lesser extent from each order. The smaller the differences, the greater the precision of the assay method.
Page 17 Measurement The procedure of applying a standard scale to a variable or a set of values. (Last, 1988) Terms used to describe properties of measurement: - Accuracy - Validity - Precision - Reliability - Repeatability - Reproducibility
Page 18 SELECTION BIAS is a distorsion in the estimate of effect resulting from the manner in which subject are selected for the study population MAJOR SOUREC OFSELECTION BIAS 1) flaws in the choice of groups to be compared 2) choice of sampling frame 3) loss to follow up or nonresponse during data collection 4) selective survival
Page 19 INFORMATION BIAS is a distortion in the measurement error or misclassification of subject on one or more variables MAJOR SOURCES OF INFORMATION BIAS 1) invalid measurement 2) incorrect diagnostic criteria 3) omissions imprecisions 4) other inadequacies in previously recorded data
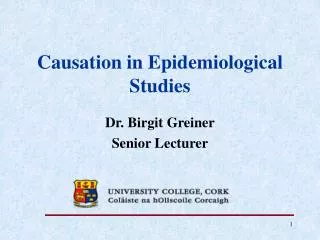
Prevalence of Down syndrome at Maternal Age Affected Babies per 1000 Live Births Maternal Age
Prevalence of Down syndrome at birth by birth order Affected Babies per 1000 Live Births Birth Order
Hypothetical Examples of Unadjusted and Adjusted Relative Risks According to Type of confounding (Positive or Negative)
Page 25 CONFOUNDING MIXING OF EFFECTS The estimate of the effect of The exposure of interest is distorted because it is mixed With the effect of an Extraneous factor
Page 26 CONFOUNDING COFFEE DRINKING, CIGARETTE SMOKING AND CORONARY HEART DISEASE EXPOSURE (coffee drinking) DISEASE (heart disease) CONFOUNDING VARIABLE (cigarette smoking)
Page 27 The distortion introduced by a confounding factor can lead to overestimation or under estimation of an effect depending on the direction of the association that the confounding factor has with exposure and disease. Confounding can even change the apparent direction of an effect. Example : Alcohol Oral cancer Smoking
E = E = D D
E = E = D D
E E D E E D
E = E = D E E D D E E D
E E D D F F Page 32 Situation in which F is a confounder for a D - E association. E D F Situation in which Fis not a confounder for a D - E association. E E E E D D D D F F F F
Page 33 To be confounding, the extraneous variable must have the following characteristics A confounding variable must be a risk factor for the disease. Aconfounding variable must be associated with the exposure under study (in the population from which the case derive). Aconfounding variable must not be an intermediate step in the causal path between the exposure and the disease.
Page 34 The data-based criterion for establishing the presence or absence of confounding involve the comparison of a crude effect measure with an adjusted effect measure that corrects for distortions due to extraneous variables. Confounding is acknowledged to be present when the crude and adjusted effect measure differ in value.
Page 35 CONTROL OF CONFOUNDING - RESTRICTION - MATCHING - STRATIFICATION - MATHEMATICAL MODEL (Multivariate analysis) DESIGN ANALYSIS
Page 36 Relation of Confounder to Disease and Exposure DISEASE EXPOSURE *MI : MYOCARDIAL INFARCTION **OC : ORAL CONTRACEPTIVE
- E E + D CRUDE RR 4 - = D Page 37 CRUDE RR RR = 4 CRR 2000 1000 1000 • Collapsed • Collapsed in 1 table without separation into subgroup.
= E = E D E E D D E E D
E E D E E D
ALC ^ CRUDE CIR = 4.0 + ^ CIR = 1.86 SM - ADJUSTED ^ + + CIR = 1.13 ^ - - CIR = 1.02 SM Page 40 EXPOSURE ALC OCa 50 200 250 DISEASE OCa 950 800 1750 2000 1000 1000 EXPOSURE NON-SMOKERS - + SMOKERS 29 6 871 94 - + 21 194 DISEASE 79 706
Page 41 Degree of Confounding measures the amount of confounding rather than mere presence or absence degree of confounding = crude measure adjusted measure = 4.00 = 3.53 1.13 Crude = 1.68 Adjusted = 3.97 d.c. = 1.68 = 0.42 3.97 over estimation under estimation
4 fold risk of MI among recent of OC users as compared to non-users. Page 42
Page 43 TYPES OF ASSOCIATION A. Not statistically associated (Independent) B. Statistically associated 1. Noncausally associated (Secondarily) 2. Causally associated a. Indirectly associated b. Directly causal
Page 44 Associationrefers to the statistical dependence between two variables that is .. The degree to which the rate of disease in person with a specific exposure is either higher or lower than the rate of disease among those without that exposure. The presence of an association, does not imply that the observed association is one of cause and effect.
STATISTICAL SIGNIFICANCE YES NO Clinical / Public Health significance Sample size big enough YES NO YES NO OK RESEARCH Page 45
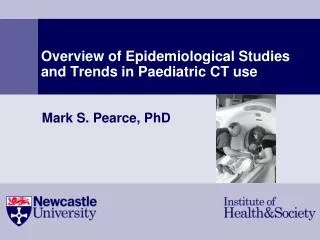
Page 46 Advantages and disadvantages of the major observational designs. (cont.) 2. CROSS-SECTIONAL
Advantages Disadvantage Scientific advantages of cohort Requires bank ofoutcomes design samples stored until occur Relatively inexpensive Page 47 Advantages and disadvantages of the major observational designs. (cont.) 4. NESTED CASE-CONTROL (Prospective or retrospective) * All of these observational designs have the disadvantages (compare to experiment) of being susceptible to the influence of confounding variables
Page 48 Advantages and disadvantages of the major observational designs 1. COHORT Advantages Disadvantages Establishes sequence of eventsOften requires large sample sizes Avoid bias in measuring predictors Not feasible for rare outcomes Avoid survival bias Can study; several outcomes Number of outcome events grows over time
Advantage Disadvantages Useful for studying rare conditionsPotential bias from sampling two population Short durationDoes not establish sequence of events Relatively inexpensiveYield odds ratio(usually a good predictors Potential bias in measuringPotential survival bias approximation of relative risk) Limited to one outcome variable Does not yield prevalence, incidence, or excess risk Page 49 Advantages and disadvantages of the major observational designs. (cont.) 3. CASE-CONTROL
INCIDENCE PREVALENCE New cases occurring during a period of time among a group initially free of disease All cases counted on a single survey or examination of a group NUMERATOR All susceptible people present at the beginning of the period All people examined including cases and new cases DENOMINATOR TIME Single point Duration of the period HOW MEASURED Prevalence (cross-sectional) study Cohort study Page 50 CHARCTERISTICS OF INCIDENCE AND PREVALENCE