Download
1 / 23
240 likes | 434 Views
“Salinity Processes in the Upper Ocean Regional Study” (SPURS) Ray Schmitt, WHOI. Outgrowth of: CLIVAR Salinity Working Group (May ‘06 meeting and ‘07 report) “Salinity” issue of Oceanography (Mar. ‘08) NASA Workshop at JPL (Dec. ‘09) Aquarius Salinity Satellite (Apr. ‘11 launch).

E N D
“Salinity Processes in the Upper Ocean Regional Study”(SPURS)Ray Schmitt, WHOI Outgrowth of: • CLIVAR Salinity Working Group (May ‘06 meeting and ‘07 report) • “Salinity” issue of Oceanography (Mar. ‘08) • NASA Workshop at JPL (Dec. ‘09) • Aquarius Salinity Satellite (Apr. ‘11 launch)
The Water Cycle Will Accelerate With Global Warming • A warmer atmosphere will carry more water vapor, because of the exponential increase of vapor pressure with temperature. • An enhanced water cycle will change the distribution of salinity in the upper ocean. Vapor Pressure, mB
Durack and Wijffels, 2010J. ClimateMean SSS 50 yr trend in SSS
SSS trends indicate significant changes are underway in the global water cycle, (which is primarily an ocean-atmosphere phenomena) • High salinity regions getting saltier • Low salinity regions getting fresher • Unless ocean mixing and transport is changing, this represents the best evidence we have for an intensification of the global water cycle. • SSS extrema are of special interest
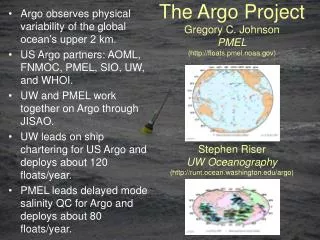
A Salinity and Water Cycle Process Experiment • Surface Salinity is closely linked to the water cycle • Launch of salinity satellite Aquarius in 2011 will provide new tool for monitoring SSS in the global ocean • ARGO array is now providing accurate S(z) profiles • Salinity sensors can be placed on surface drifters • Planning underway for a salinity and water cycle process experiment in 2012 • Initial site: Salinity maximum region of the North Atlantic
Potential location for a process study Objectives: What processes maintain the salinity maximum? Where does the excess salt go? What processes give rise to temporal variability? What is the larger impact on the shallow overturning circulation? Location advantages: >Low >Low precip 1D phys. >Modest eddy activity >Source of water for northern tropical thermocline >Stable S for Cal-Val > Warm (better for Aquarius) > Leverages other resources: 24 N section, Pirata Array, ESTOC time series (Canary Islands) > Logistically tractable
Surface Salinity (note SSS max is north of E-P max. due to Ekman transport and convergence) • Evap. – Precip. (note E-P zero is close to vegetation boundary in Africa)
Upper-ocean salinity balance: a - rate of change of mixed layer salinity b - advection by mean surface flow c - divergence of horizontal surface fluxes d - vertical entrainment/subduction/obduction e - surface salt gain or loss due to evaporation – precipitation f - small-scale vertical mixing and skin effects
The surface eddy kinetic energy in the Atlantic estimated by Fratantoni (2001). The patterns are similar to those derived from altimetric data. The white area west of Africa corresponds to a region of low surface velocity and upwelling, thus few drifters linger in this area. The Salinity maximum corresponds with an area of low eddy kinetic energy.
Upper thermocline is favorable to salt fingers (~1/2 mixing in NATRE) indicated by high Turner Angle, especially in late winter/spring
Haline convection -Hage and Tilgner (2010, Phys. Fluids, in press)Tz > 0, but Rr <1 Tz = 0 New parameter regime for salt fingers!
Ekman transport vectors in Sverdrups (1 Sv = 106 m3s-1) and 10 cm contours of mean dynamic topography of the sea surface. In color, the long-term mean sea surface salinity. Ekman transports were computed across 2.5ºx2.5º latitude-longitude cells using long-term mean wind stresses based on ECMWF ERA-40 monthly data (Uppala et al. 2005). Sea surface salinity was computed from the 1ºx1º World Ocean Atlas 2005 (Antonov et al. 2006). N. Maximenko and P. Niiler provided the 1990-2002 mean ocean dynamic topography data (Maximenko and Niiler, 2005).
Tools for the Field Program: • Floats • Gliders • Drifters • Moorings • Ships • Satellites • Micro-structure profiling
Possible SPURS elements: • 3-4 months of dedicated ship time (medium class) over the course of 1 year. • Seagliders for occupation of the butterfly boxes, • Mesoscale gliders and more AUVs (Spray, Slocum, Remus) some equipped with microstructure sensors, • Microstructure profilers including surface skin profilers such as ASIP, several EM profiling floats for examining mixing associated with inertial motions, temperature and shear microstructure capability on profiling floats. Salinity microstructure capability on profiler, floats and gliders (under development) • A well-instrumented surface flux mooring, in place for at least one year, and densely instrumented with T, S, and velocity sensors in the upper 500 m • A towed ship-based profiling CTD and ADCP • SSS-equipped drifters • Multiple scale (global/basin/region) 3-dimensional eddy-resolving ocean models with data assimilation capabilities over the selected field experiment region to support pre-FE OSSEs, realtime operations and post-experiment reanalysis. Also process models are required to test parameterizations as well as mesoscale atmospheric models for improved estimates of air-sea fluxes. • Data server and archive
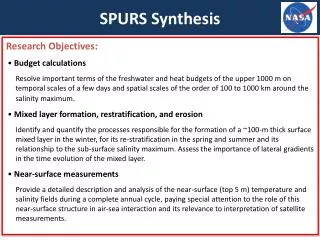
Central Questions: Can we begin to understand the main processes controlling the upper-ocean salinity (and thus water) budget with new salinity sampling tools? Can we identify the optimal observing system requirements for the future by over- sampling in one region? • This will be most tractable where horizontal advection is weak. Thus the choice of the salinity maximum region, where the salinity balance must become one dimensional, and precipitation is small. • Future experiments (SPURS II) will address high precipitation regions (which generally have large horizontal advection as well).
SPURS - I • Goal: Identify the important processes controlling SSS in S-max. • Field program 2012-2013 • Modeling and data assimilation • Data server/archiving for public access • Cal/val for Aquarius & SMOS • Improved parameterizations for subgrid-scale processes in ocean models Optimize elements of the ocean observing system
Cruises: • Spanish, Spring 2012 (Project funded, cruise uncertain) • French/Irish, Summer 2012 (Proposed) • US, Spring,Fall 2012, Spring 2013 (Proposed) • + possible NOAA opportunities
SPURS Timing (a work in progress): • NASA Field work proposals received May 28 • Discussion session tomorrow • NSF proposals due Aug. 15. • ONR ? • NASA Salinity Science Team proposals due Oct. 29. • PI Planning Meeting, Jan 2011. http://ourocean.jpl.nasa.gov/SPURS/tindex.jsp