Download
1 / 1
10 likes | 107 Views
Poster 02.06. Immunized ND. ND. SLE. ND. SLE. ND. Immunized ND. Immunized ND. CD4+ T cells CD16 - Mo CD16 + Mo. 4 ND. 4 ND. 3 ND.

E N D
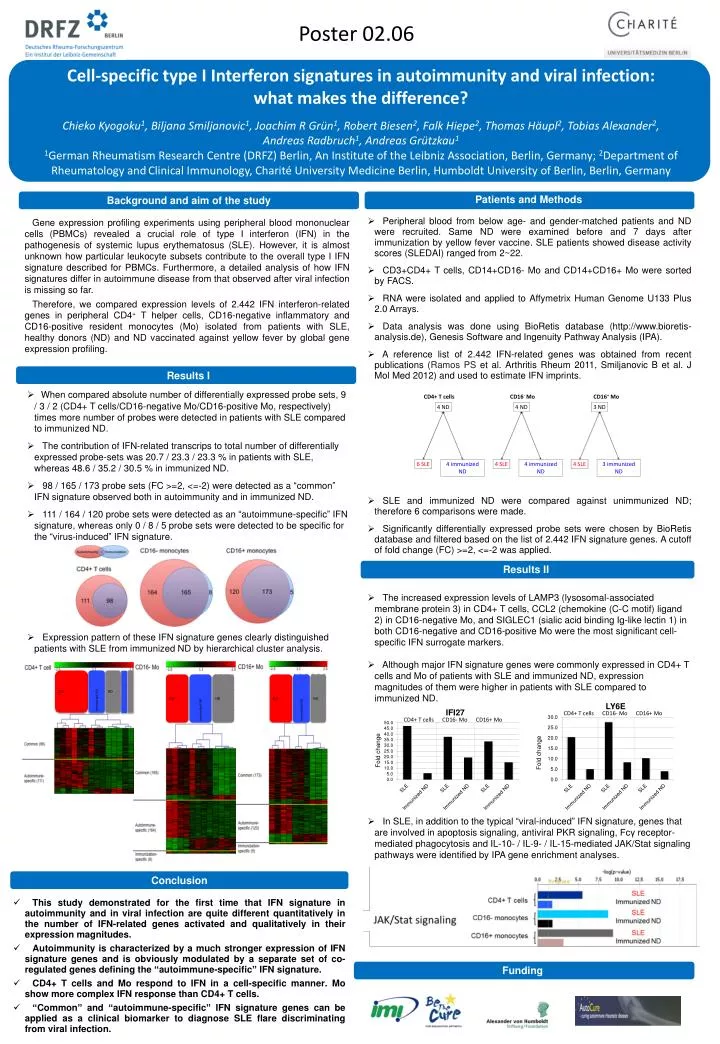
Poster 02.06 Immunized ND ND SLE ND SLE ND Immunized ND Immunized ND CD4+ T cells CD16- Mo CD16+ Mo 4 ND 4 ND 3 ND Cell-specific type I Interferon signatures in autoimmunity and viral infection: what makes the difference? Chieko Kyogoku1, Biljana Smiljanovic1, Joachim R Grün1, Robert Biesen2, Falk Hiepe2, Thomas Häupl2, Tobias Alexander2, Andreas Radbruch1, Andreas Grützkau1 1German Rheumatism Research Centre (DRFZ) Berlin, An Institute of the Leibniz Association, Berlin, Germany; 2Department of Rheumatology andClinical Immunology, Charité University Medicine Berlin, Humboldt University of Berlin, Berlin, Germany CD4+ T cells CD16- Mo CD16+ Mo 6 SLE 4 immunized ND 4 SLE 4 immunized ND 4 SLE 3 immunized ND Fold change Patients and Methods Background and aim of the study • Peripheral blood from below age- and gender-matched patients and ND were recruited. Same ND were examined before and 7 days after immunization by yellow fever vaccine. SLE patients showed disease activity scores (SLEDAI) ranged from 2~22. • CD3+CD4+ T cells, CD14+CD16- Mo and CD14+CD16+ Mo were sorted by FACS. • RNA were isolated and applied to Affymetrix Human Genome U133 Plus 2.0 Arrays. • Data analysis was done using BioRetis database (http://www.bioretis-analysis.de), Genesis Software and Ingenuity Pathway Analysis (IPA). • A reference list of 2.442 IFN-related genes was obtained from recent publications (Ramos PS et al. Arthritis Rheum 2011, Smiljanovic B et al. J Mol Med 2012) and used to estimate IFN imprints. • SLE andimmunized ND werecomparedagainstunimmunized ND; therefore 6 comparisonsweremade. • Significantly differentially expressed probe sets were chosen by BioRetis database and filtered based on the list of 2.442 IFN signature genes. A cutoff of fold change (FC) >=2, <=-2 was applied. Gene expression profiling experiments using peripheral blood mononuclear cells (PBMCs) revealed a crucial role of type I interferon (IFN) in the pathogenesis of systemic lupus erythematosus (SLE). However, it is almost unknown how particular leukocyte subsets contribute to the overall type I IFN signature described for PBMCs. Furthermore, a detailed analysis of how IFN signatures differ in autoimmune disease from that observed after viral infection is missing so far. Therefore, we compared expression levels of 2.442 IFN interferon-related genes in peripheral CD4+ T helper cells, CD16-negative inflammatory and CD16-positive resident monocytes (Mo) isolated from patients with SLE, healthy donors (ND) and ND vaccinated against yellow fever by global gene expression profiling. Results I • When compared absolute number of differentially expressed probe sets, 9 / 3 / 2 (CD4+ T cells/CD16-negative Mo/CD16-positive Mo, respectively) times more number of probes were detected in patients with SLE compared to immunized ND. • The contribution of IFN-related transcrips to total number of differentially expressed probe-sets was 20.7 / 23.3 / 23.3 % in patients with SLE, whereas 48.6 / 35.2 / 30.5 % in immunized ND. • 98 / 165 / 173 probe sets (FC >=2, <=-2) were detected as a “common” IFN signature observed both in autoimmunity and in immunized ND. • 111 / 164 / 120 probe sets were detected as an “autoimmune-specific” IFN signature, whereas only 0 / 8 / 5 probe sets were detected to be specific for the “virus-induced” IFN signature. • Expression pattern of these IFN signature genes clearly distinguished patients with SLE from immunized ND by hierarchical cluster analysis. Results II • The increased expression levels of LAMP3 (lysosomal-associated membrane protein 3) in CD4+ T cells, CCL2 (chemokine (C-C motif) ligand 2) in CD16-negative Mo, and SIGLEC1 (sialic acid binding Ig-like lectin 1) in both CD16-negative and CD16-positive Mo were the most significant cell-specific IFN surrogate markers. • Although major IFN signature genes were commonly expressed in CD4+ T cells and Mo of patients with SLE and immunized ND, expression magnitudes of them were higher in patients with SLE compared to immunized ND. • In SLE, in addition to the typical “viral-induced” IFN signature, genes that are involved in apoptosis signaling, antiviral PKR signaling, Fcγ receptor-mediated phagocytosis and IL-10- / IL-9- / IL-15-mediated JAK/Stat signaling pathways were identified by IPA gene enrichment analyses. CD4+ T cells CD16- Mo CD16+ Mo Fold change SLE Conclusion • This study demonstrated for the first time that IFN signature in autoimmunity and in viral infection are quite different quantitatively in the number of IFN-related genes activated and qualitatively in their expression magnitudes. • Autoimmunity is characterized by a much stronger expression of IFN signature genes and is obviously modulated by a separate set of co-regulated genes defining the “autoimmune-specific” IFN signature. • CD4+ T cells and Mo respond to IFN in a cell-specific manner. Mo show more complex IFN response than CD4+ T cells. • “Common” and “autoimmune-specific” IFN signature genes can be applied as a clinical biomarker to diagnose SLE flare discriminating from viral infection. Funding