Download
1 / 15
150 likes | 259 Views
Temporal Dynamics of Dissolved Oxygen in Massachusetts Bay. Amanda Hyde Advisors: Doug Vandemark & Joe Salisbury Research and Discovery, 2009. Initial Question: Has the DO in GOM experienced an average decrease over the past century due to the temperature rise?. The Motivation:

E N D
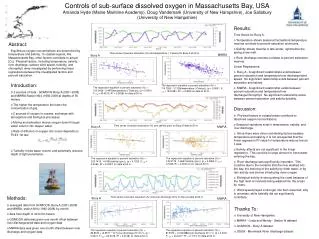
Temporal Dynamics of Dissolved Oxygen in Massachusetts Bay Amanda Hyde Advisors: Doug Vandemark & Joe Salisbury Research and Discovery, 2009
Initial Question:Has the DO in GOM experienced an average decrease over the past century due to the temperature rise? • The Motivation: • Shearman et al., 2004 showed eastern seaboard experiencing 0.02°C yearly temperature rise. • SST data from Boothbay Harbor agrees. • Had access to long term data in GOM. • (Shearman, R. K., Lentz, S. J., Silverthorne, K., 2004. Sea surface temperature variability along the Middle Atlantic bight over the last 100 years. EOS Trans. AGU, 84: 52, Ocean Sci. Meeting Suppl., Abstract OS21N-03)
Tools of Measurement Winkler Seabird Optode DO Depends On… 1st Order Physics like Temperature & Salinity Biology (photosynthesis/ respiration) Circulation Physics (storms/river discharge/water masses) Measurements and Constraints (Hyde, 2009) (Hyde, 2009)
AOU = [O2]equ-[O2] Percent Saturation of [O2] = ([O2]/[O2]equ)*100 [O2] Equations: • Equilibrium Oxygen determined by Table 1 of Garcia and Gordon based on temperature and salinity values. (Benson and Krause, 1984) (Benson, B. B., Krause, Jr., D. 1984. The concentration and isotopic fractionation of oxygen dissolved in freshwater and seawater in equilibrium with the atmosphere. Limnology and Oceanography. 29,3: 620-632)
Water Masses in GOM • 4 main water masses in the GOM • Water masses based on temperature, salinity, and depth • change in slope on the T-S diagram indicates the change in water mass • Figure taken from Warn-Varnas, et al., 2005 • Profile is of June 1982 (Warn-Varnas, A., Gangopadhyay, A., Hawkins, J. A., Robinson, A. R., 2005. Wilkinson Basin area water masses: a revisit with EOFs. Continental Shelf Research. 25: 277-296.) T S
The Data • NODC • GOMOOS Buoy A • Mouth of Merrimack River • Boothbay Harbor, ME SST
What Happened? • Many factors influence DO value, not just temperature and salinity • GOM is a complex system • Not enough resolution in the NODC data
GOMOOS Buoy A Data Temperature’s Effect on DO:
Yearly Difference in Percent Saturation Test=Wilcoxon/Mann-Whitney U-test, p<0.0001, DF=6 Tukey’s HSD test, p<0.05 D B C A B C C Test=Wilcoxon/Mann-Whitney U-test, p<0.0001, DF=6 Tukey’s HSD test, p<0.05 D BC A A C C B
In Conclusion… • Could not conclude that the DO in Massachusetts Bay is decreasing as temperature increases: too many contributing parameters. • Better resolution, long-term data necessary to answer initial question. • Temperature does significantly affect DO value. • Storms play a significant role on DO in the GOM. • There is a significant different in percent saturation values from year to year.
What’s Next? • Collect more high resolution data over longer time span; thus enabling better sense of correlations. • Sources like GOMOOS and MWRA provide highly valuable data sets. • Collaboration with USECoS. • Can DO changes be tracked from satellites? • Could biological and circulation physical controls help offset the decrease in DO due to global warming? (Hyde, 2009)
Special Thanks to… • My advisors Doug Vandemark and Joe Salisbury • Chris Hunt and Mimi Szeto for aiding me in programming MATLAB • Mark Lazzari of the Department of Marine Resources, State of Maine • National Oceanographic Data Center • Gulf of Maine Ocean Observation System • U.S. Geological Survey for Merrimack River discharge data
References • Applebaun, S., Montagna, P. A., Ritter, C. 2005. Status and trends of dissolved oxygen in Corpus Christi Bay, Texas, U.S.A. Environmental Monitoring and Assessment 107: 297-311. • Boyer, T., Conkright, M. E., Levitus, S. 1999. Seasonal variability of dissolved oxygen, percent oxygen saturation, and apparent oxygen utilization in the Atlantic and Pacific Oceans. Deep-Sea Research I. 46: 1593-1613. • Craig, H., Hayward, T. 1987. Oxygen supersaturation in the ocean: bioloigical versus physical contributions. Science, New Series. 235, 4785: 199-202. • Garcia, H. E., Boyer, T. P., Levitus, S., Locarnini, R. A., Antonov, J., 2005. On the variability of dissolved oxygen and apparebt oxygen utilization content for the upper world ocean: 1955 to 1998. Geophysical Research Letters. 32. • Hopkins, T. S., Garfield III, N., 1979. Gulf of Maine intermediate water. Journal of Marine Research 37: 103-139. • Libes, S. M., 1992. An introduction to marine biogeochemistry. John Wiley & Sons, Inc. New York. • Loder, J. W., Shore, J. A., Hannah, C. G., Petrie, B. D. 2001. Decadal-scale hydrographic and circulation variability in the Scotia-Maine region. Deep-Sea Research II. 48: 3-35. • Najjar, R., Siewert, J., O’Reilly, J. Respiration in the Gulf of Maine inferred from climatologies of dissolved oxygen and primary production. (poster) • Pilson, M. E. Q., 1998, An introduction to the chemistry of the sea. Prentice Hall. Upper Saddle River, New Jersey. • Tomczak, M. 1999. Some historical, theoretical and applied aspects of quantitative water mass analysis. Journal of Marine Research. 57: 275-303. • Wanamaker Jr., A. D., Kreutz, K. J., Sche, B. R., Maasch, K. A., Pershing, A. J., Borna, H. W., Introne, D. S., Feindel, S. 2009. A late Holocene paleo-productivity record In the western Gulf of Maine, USA, inferred from growth histories of the long-lived ocean quahog (Arctica islandica). Int J Earth Sci. 98: 19-29. • Warn-Varnas, A., Gangopadhyay, A., Hawkins, J. A., Robinson, A. R., 2005. Wilkinson Basin area water masses: a revisit with EOFs. Continental Shelf Research. 25: 277-296.