Download
1 / 5
50 likes | 153 Views
The graph would shift 2 units up. A. The graph would shift 4 units up. B. The graph would shift 4 units down. C. The graph would shift 4 units to the left. D. EXAMPLE 5. Standardized Test Practice.

E N D
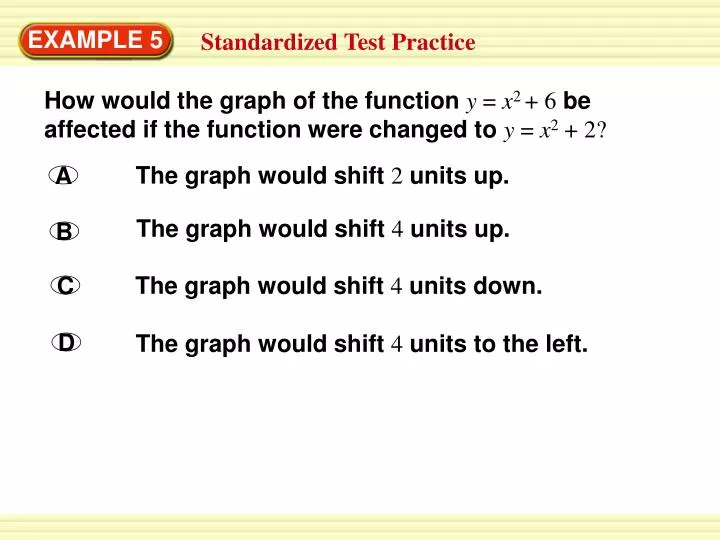
The graph would shift 2 units up. A The graph would shift 4 units up. B The graph would shift 4 units down. C The graph would shift 4 units to the left. D EXAMPLE 5 Standardized Test Practice How would the graph of the function y = x2 + 6 be affected if the function were changed to y = x2 + 2?
ANSWER The correct answer is C. A D B C EXAMPLE 5 Standardized Test Practice SOLUTION The vertex of the graph of y = x2 + 6 is 6 units above the origin, or (0, 6). The vertex of the graph of y = x2 + 2 is 2 units above the origin, or (0, 2). Moving the vertex from (0, 6) to (0, 2) translates the graph 4 units down.
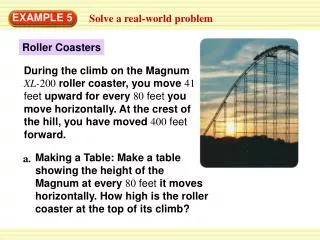
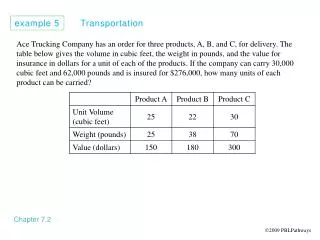
EXAMPLE 6 Use a graph SOLAR ENERGY A solar trough has a reflective parabolic surface that is used to collect solar energy. The sun’s rays are reflected from the surface toward a pipe that carries water. The heated water produces steam that is used to produce electricity. The graph of the function y = 0.09x2 models the cross section of the reflective surface where xandyare measured in meters. Use the graph to find the domain and range of the function in this situation.
EXAMPLE 6 Use a graph SOLUTION STEP 1 Find the domain. In the graph, the reflective surface extends 5 meters on either side of the origin. So, the domain is 5 ≤ x ≤ 5. STEP 2 Find the range using the fact that the lowest point on the reflective surface is (0, 0) and the highest point, 5, occurs at each end. y = 0.09(5)2= 2.25 Substitute 5 for x. Then simplify. The range is 0≤ y ≤ 2.25.
Describe how the graph of the function y = x2+2 would be affected if the function were changed to y=x2– 2. WHAT IF? In Example 6, suppose the reflective surface extends just 4 meters on either side of the origin. Find the domain and range of the function in this situation. 7. 8. ANSWER ANSWER The graph would be translated 4 units down. Domain: – 4 ≤ x ≤ 4, Range: 0 ≤y ≤1.44 for Examples 5 and 6 GUIDED PRACTICE