Download
1 / 21
210 likes | 313 Views
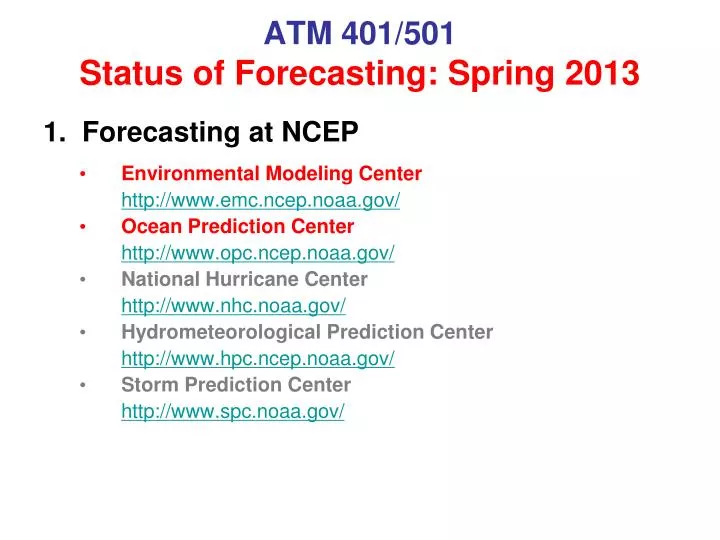
ATM 401/501 Status of Forecasting: Spring 2013. 1. Forecasting at NCEP Environmental Modeling Center http://www.emc.ncep.noaa.gov/ Ocean Prediction Center http://www.opc.ncep.noaa.gov/ National Hurricane Center http://www.nhc.noaa.gov/ Hydrometeorological Prediction Center

E N D
ATM 401/501Status of Forecasting: Spring 2013 1. Forecasting at NCEP • Environmental Modeling Center http://www.emc.ncep.noaa.gov/ • Ocean Prediction Center http://www.opc.ncep.noaa.gov/ • National Hurricane Center http://www.nhc.noaa.gov/ • Hydrometeorological Prediction Center http://www.hpc.ncep.noaa.gov/ • Storm Prediction Center http://www.spc.noaa.gov/
Transition to IBM Power 6 complete Declared operational August 12, 2009 69.7 trillion calculations/sec Factor of 4 increase over the IBM Power5 4,992 processors 20 terabytes of memory 330 terabytes of disk space 1.7 billion observations/day 27.8 Million model fields/day Primary: Gaithersburg, MD Backup: Fairmont, WV Guaranteed switchover in 15 minutes Web access to models as they run on the CCS Central Computer System (CCS) X
Some FindingsStill Very Preliminary • Data focus on satellite and aircraft • Could be bias issues • Potential warm bias in aircraft data • Several bias issues in satellite • Potential impact from over sampling (aircraft and satellite) • Could have analysis issue with respect to how the observation biases are handled, especially in the tropics and the SH • Size of analysis window (2.5 hr vs 6 hr vs 12 hr) could be an important issue X
Poor Forecasts or Skill Score “Dropouts” Lower GFS Performance October 26, 2008 For this Dropout see IC on next slide... X
Trough in central Pacific shows differences between ECMWF (no dropout) and GFS (had dropout) Ovrly “patch” box ECM in this area but GSI elsewhere X
NCEP Climate Forecast System Reanalysis • Complete as of November 2009 • A global, high resolution, coupled atmosphere-ocean-land surface-sea ice system for the period 1979-2009. • Atmosphere resolution: 38 km (T382), 64 levels extending to 0.26 hPa • Ocean resolution: 0.25 degree at the equator, 40 levels to 4737 m depth • Products available at hourly time resolution, 0.5 degree horizontal resolution, and at 37 standard pressure levels • CFSR products began being transmitted on December 7, 2009, to the NOAA National Climate Data Center (NCDC), the official dissemination outlet for the CFSR. NCAR will also host a copy of the CFSR. • CPC is in the process of generating its operational climate diagnostics products from the CFSR data. • An operational implementation of the entire CFSR system, including all hindcast model runs, is scheduled for Q1 of FY11. X
ATM 401/501Status of Forecasting: Spring 2013 1. Forecasting at NCEP • Environmental Modeling Center http://www.emc.ncep.noaa.gov/ • Ocean Prediction Center http://www.opc.ncep.noaa.gov/ • National Hurricane Center http://www.nhc.noaa.gov/ • Hydrometeorological Prediction Center http://www.hpc.ncep.noaa.gov/ • Storm Prediction Center http://www.spc.noaa.gov/
Extratropical Oceanic Cyclogenesis - Major Forecast Challenges Remain • Under-prediction of most rapid intensification phase of extratropical cyclogenesis – hurricane force winds (It is not just a tropical problem!!) GFS 96 hr VT 1200 UTC 8 Nov 2008 Analysis 1200 UTC 8 Nov 2008 974 mb Max Wind 70 knots HURRICANE FORCE 983 mb Max Wind 46 knots GALE X
Hurricane Force Extratropical Cyclones Detection and Warning Trend using QuikSCAT • Hurricane Force Warning Initiated Dec 2000 • Detection increased with: • Forecaster familiarity • Data availability • Improved resolution • Improved algorithm Improved wind algorithm and rain flag Oct 06 WARNING CATEGORIES Pre- QSCAT 1. GALE 34-47 kt 2. STORM >48 QSCAT ERA 1. GALE 34-47 kt 2. STORM 48 -63 kt 3. HURCN FORCE > 64 kt 12.5 km QuikSCAT available May 04 Pre-QSCAT 25 km QuikSCAT Available in N-AWIPS Oct 01 QSCAT ERA Hurricane Force Wind Warning Initiated Dec 00 244 235 3. HURCN FORCE > 64 kt QuikSCAT Launch Jun 99 X
2 & 4 day cyclone forecast skill ATL PAC ATL PAC (Observed - Forecast) (Observed - Forecast) All Cyclones All Cyclones Hurricane Force Hurricane Force Negative (underforecast) Negative (underforecast) ATL PAC ATL PAC Intensity (hPa) Track (n mi) X
2 & 4 day warning skill POD FAR X
Minimum MSLP (CFSR, Jan 1979 - Mar 2011; courtesy Ryan Maue)
Minimum MSLP (CFSR, Jan 1979 - Mar 2011; courtesy Ryan Maue)
Minimum MSLP (CDASv2, 1 Jan – 4 Feb 2013; courtesy Ryan Maue)
Major Shipping Routes North Atlantic 4,000/yr container transits 1,000/yr bulkers Geographic distribution of cyclones with winds of HF intensity Sep-May 2000-2007 7 yr annual average number of extratropical cyclones observed (contoured) with hurricane force winds for the years 2001 - 2008 X
Major Shipping Routes North Pacific 6,000/yr container 1,500/yr bulker Geographic distribution of cyclones with winds of HF intensity Sep-May 2000-2007 7 yr annual average number of extratropical cyclones observed (contoured) with hurricane force winds for the years 2001 - 2008 X