Download
1 / 22
230 likes | 328 Views
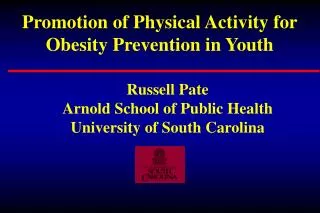
Obesity: A National Health Issue. William H. Dietz, MD, PhD Director Division of Nutrition and Physical Activity Centers for Disease Control and Prevention 24 September 2005. 1991. Obesity Trends* Among U.S. Adults 1991, 1996, 2004. 1996. 2004. No Data. <10%. 10%-14%. 15%-19%.

E N D
Obesity: A National Health Issue William H. Dietz, MD, PhD Director Division of Nutrition and Physical Activity Centers for Disease Control and Prevention 24 September 2005
1991 Obesity Trends* Among U.S. Adults1991, 1996, 2004 1996 2004 No Data <10% 10%-14% 15%-19% 20%-24% 25%
Relation of BMI Levels to Fat Mass Index in 9-14 yo Boys and Girls (Pearson correlation coefficients adjusted for race and age) BMI for Age <50th %tile 50-84th %tile >85th %tile Boys 9-11y 0.45 0.43 0.95 Boys 12-14 y 0.45 0.53 0.85 Girls 9-11y 0.56 0.77 0.93 Girls 12-14y 0.58 0.36 0.96 Freedman et al. Int J Obesity 2005;12:1-8.
Prevalence of Overweight* Among U.S. Children and Adolescents • *Gender- and age-specific BMI > the 95th percentile 1963-70 NHES II & III 1971-74 NHANES I 1976-80 NHANES II 1988-94 NHANES III 1999-2000 NHANES
Overweight Prevalence by Race/Ethnicity for Adolescent Boys Aged 12 - 19 Years Percentage Source: JAMA, 2004;291:2847
Overweight Prevalence by Race/Ethnicity for Adolescent Girls Aged 12 - 19 Years Percentage Source: JAMA, Oct. 9, 2002, Vol. 288, No. 14:1731
BMI and Distribution of Morbid Obesity BMI @99%tile* > BMI 40** % > 99%tile Males 16yo 33.9 1.6% 8.1% 17yo 34.4 0.3% 6.4% 18yo 35.0 0.1% 3.6% 19yo 36.0 3.1% 3.5% Females 16yo 39.1 1.6% 1.6% 17yo 40.8 2.3% 2.0% 18yo 42.9 1.7% 0.7% 19yo 45.4 3.3% 0.7% *CDC growth charts **NHANES 1999-2002
Prevalence of Risk factors by BMI Percentile (Bogalusa Data)
Consequences of Childhood and Adolescent Obesity Common Uncommon • Growth • Psychosocial • Hyperlipidemia • Hepatic steatosis • Abnormal glucose metabolism • Asthma • Persistence into adulthood • Hypertension • Sleep apnea • Pseudotumor • PCOD • Cholelithiasis • Orthopedic
Prevalence of the Metabolic Syndrome and Abnormalities by BMI Status Overall Normal At Risk Overweight (<85%) (85-94%) (>95%) %%%% Metabolic Syndrome 4.4 0.01 4.6 35+ High triglycerides 23 18 34* 52+ Low HDL 23 18 32* 50+ High Fasting Glucose 1.4 0.7 4 3 High Blood Pressure 5 3 9 11+ *p-value <.05 for at risk vs. normal adolescents +p-value <.05 for overweight vs. normal adolescents
Consequences of Childhood and Adolescent Obesity Common Uncommon • Growth • Psychosocial • Hyperlipidemia • Hepatic steatosis • Abnormal glucose metabolism • Asthma • Persistence into adulthood • Hypertension • Sleep apnea • Pseudotumor • PCOD • Cholelithiasis • Orthopedic
Impact of Childhood Overweight (BMI > 95th percentile) on Adult Obesity (BMI > 30) 4.9 BMI unit difference in severity Onset < 8y more severely obese as adults ( BMI = 41.7 vs 34.0) CVD risk factors reflect adult BMI 25% obese adults were overweight children Freedman et al, Pediatrics 2001; 108: 712
Consequences of Childhood and Adolescent Obesity Common Uncommon • Growth • Psychosocial • Hyperlipidemia • Hepatic steatosis • Abnormal glucose metabolism • Asthma • Persistence into adulthood • Hypertension • Sleep apnea • Pseudotumor • PCOD • Cholelithiasis • Orthopedic
Duration of Diabetes and Nephropathy (Pima Indians) Cumulative Incidence Nephropathy (%) • The duration of diabetes, rather than the age at diagnosis, is predictive of nephropathy (Krakoff. Diabetes Care 2003;26:76) 35 - 44 Y 15 - 24 Y 25 - 34 Y Duration (years)
RR=1.8 (91/1200) RR=2.0 (46/1100) Childhood BMI and Adult Mortality: 32 y Follow-up of 227,000 Norwegian Adolescents Measured in 1963-75 Mortality per 1000 PY Boys Girls Childhood BMI-for-Age Percentile A Engeland, Am J Epidemiol 2003;157:517
Distribution of BMI among 17- to 19-year-olds Norway (1963-75) 1% had a BMI ≥ 30 0.08 0.08 US (1999-2002) 14%, BMI ≥30 0.04 0.04 0.00 0.00 15 15 20 20 25 25 30 30 35 35 40 40 45 45 50 50 BMI
Costs of Obesity Costs of illness Costs of absence from work Costs of reduced productivity Costs of injuries Costs of disability
Percent of All Excess Health Care Expenditures Associated with Obesity Source: R. Sturm, personal communication.
Cost for Weight plus Additional Risk Factors $7,000 BMI<25 BMI 25-30 BMI 30-35 BMI>35 $6,000 $5,000 $4,000 $3,000 $2,000 $1,000 $0 BMI BMI +1 BMI +2 BMI +3 BMI +4 BMI +5 Only BMI +6 Risk Risks Risks Risks Risks or more * Average annual paid healthcare costs (including pharmacy) from 1997 to 2000; N=222,933.
Costs of Obesity Costs of illness Costs of absence from work Costs of reduced productivity Costs of injuries Costs of disability
Therapeutic Approaches to the Treatment of Obesity • Behavioral • dietary alteration • increase activity • decrease inactivity • Aggressive dietary therapy • Pharmacologic • Surgical