Download
1 / 55
550 likes | 689 Views
Mesoscale Observing Challenges: One Perspective with Emphasis on the Urban Zone. Walt Dabberdt Director, Strategic Research Vaisala - Boulder, Colorado. presentation to the: NSF Observing Facilities Users Workshop 24-26 September 2007 NCAR Boulder, CO. Presentation Outline.

E N D
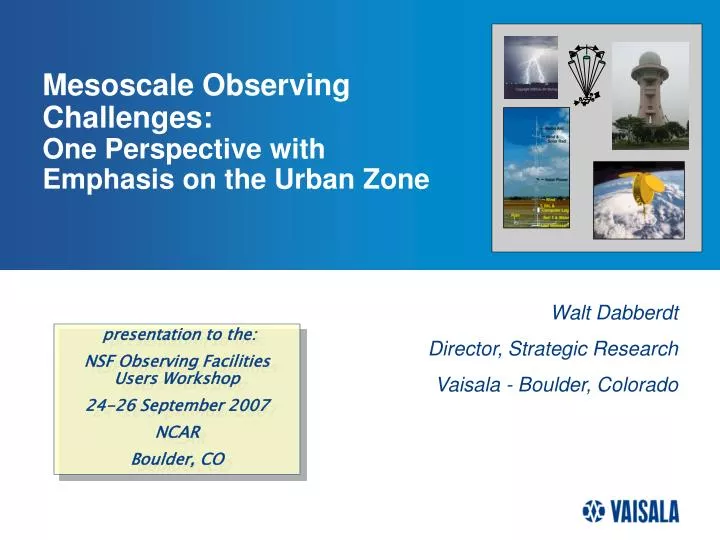
Mesoscale Observing Challenges: One Perspective with Emphasis on the Urban Zone Walt Dabberdt Director, Strategic Research Vaisala - Boulder, Colorado presentation to the: NSF Observing Facilities Users Workshop 24-26 September 2007 NCAR Boulder, CO
Presentation Outline • Urban Demographics & Challenges • Importance of the PBL • Measurement Systems • Mesoscale Networks and Testbeds
Presentation Outline • Urban Demographics & Challenges • Importance of the PBL • Measurement Systems • Mesoscale Networks and Testbeds
Ten(10) Largest Cities in 1000A.D. (M-Inhabitants) Source: Tertius Chandler: “4,000 Years of Urban Growth” (1987)
2015 2000 1950
Growth of Mega-Cities blue = coastal city green = inland city most mega-cities are in the less developed regions (16) 379.3 (23) Source: UN Population Division, March 2000
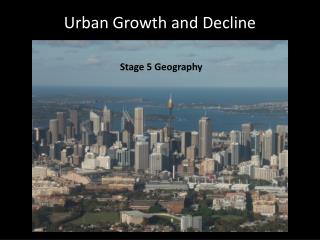
The March of Urbanization in the World (% global population) Today, 1.3 million people are moving to the cities every week!
Growth by City Size Contrary to popular belief, the bulk of urban population growth is likely to occur in smaller cities and towns of less than 500,000.
Some Relevant City Factoids (source: Arnulf Gruber, 2004) • ~50% world population (~2007) • > 80(?)% world GDP (few data) • > 80(?)% world electricity • [wfd: ~ CO2 eq. emissions?; no good data] • ~ 95% world internet sites and internet traffic (good data) • 78% mega-cities are coastal [wfd] • 70% mega-cities are in less-developed regions [wfd]
Warm Season Events Tornadoes Mesoscale boundaries Mesoscale systems Convection (localized) Hurricanes/Tropical storms Flash floods and main-stem flooding Fire weather events Air quality episodes (O3) Heat waves Toxic plumes Winter Season Events Fronts/short-waves Liquid/freezing/frozen boundaries Ice storms Orographic (e.g., lake effect storms) Blizzards/Wind chill Coastal Gales Air quality episodes (PM) Cold air outbreaks Toxic plumes Examples of Mesoscale Events That Impact Human Well-Being and/or Have Major Economic Impacts
Tornado – Ft. Worth, TX simulation Source: North Central Texas Council of Governments March 28, 2000 Path Length: Approximately 3 miles Path Width: 1/4 mileF-Scale: F1 (73-112mph) to F2 (113-157mph)
MODIS Imagery: France Heat Wave -- August 13-28, 2003 Solid lines demarcate conventional climate zones. Vegetation index anomaly Surface temperature anomaly Source: Zaitchik et al., 2006
Three Recent Heat Waves Source: Earth Science and Applications from Space: National Imperatives for the Next Decade and Beyond (2007)
Hurricane Katrina (2005) Tracks: Forecasts and Actual Courtesy of James Franklin, NHC
Presentation Outline • Urban Demographics & Challenges • Importance of the PBL • Measurement Systems • Mesoscale Networks and Testbeds
City-Atmosphere Interactions • Bi-directional physical problem with feedbacks: • Weather and Climate Impacts on the City • Quality of life • Economy • Human health and mortality • Urban effects on the atmosphere • Direct:Indirect: • sensible heat urban heat island • runoff and latent heat human heat stress • thermal conductivity and heat capacity PBL & ML structure • aerodynamic roughness cloud cover & precip. • zero-plane displacement insolation and radiation • gaseous and particulate loading balance • sun shading local circulations
Why the Planetary Boundary Layer? Courtesy of Fed Carr, NAOS PBL contains the for weather Convective events in well mixed layer during daytime heating Fog and low clouds under nocturnal inversion Layer of air containing the roots of summertime convection Low-level jet Depth of cold air in winter to tops of stratocumulus
The Need for Mesoscale Observations -- as Reported by the North American Observing System (NAOS) Study* • Need to measure mesoscale phenomena at resolution that is high enough to accurately represent these mesoscale features in the initial conditions of a mesoscale model • If using 6-8 grid points per wavelength criterion, then the needed resolution can be estimated as follows: • 20-30 km resolution for jet streams, IPV details, etc. • But 0.1 – 1 km resolution to observe thunderstorm updrafts and downdrafts * Courtesy of: Fred Carr, Univ. Oklahoma
What Additional Observations Are Needed? (source: NAOS) Critical to get forcing correct in PBL, and short waves in troposphere • Tropopause (8~13 km) • Jet Stream • Mid Troposphere (2~8 km) • Location/intensity of short waves • PBL (Sfc~2 km) • Ageostrophic • Orographic • Temp, Moisture, Wind, Precipitation • Surface/sub-surface conditions Satellite imagery & soundings PBL has largest unmet need for improved observations (assuming that next-generation satellite sensors measure V, T and q at needed resolutions and precision above the PBL) Courtesy of: Fred Carr, Univ. Oklahoma
Why the PBL? (source: NAOS) Need 100-200m resolution! ~2km • The greatest need in future mesoscale observing capability is high verticalresolution of T, q and windin the PBL. • Slight variations in these values will have a major impact on: • thunderstorm vs. severe thunderstorm vs. squall line vs. MCC, • and subsequent forecasts of flooding, winds, temperatures, etc., • and consequent impacts on health, safety, agriculture, transportation, energy, etc. Courtesy of: Fred Carr, Univ. Oklahoma
Measurement Capabilities: Transport & Diffusion Scales Daytime Boundary Layer ACARS Rawinsondes Modeling Gap RADAR Sfc Obs Surface Layer Building Urban Storm Fronts Synoptic 1 mm 1 cm 1 m 10 m 100 m 1 km 10 km 100 km 1000 km Horizontal grid spacing Slide courtesy Walter Bach, ARO
Measurement Capabilities: Transport & Diffusion Scales ACARS RADAR Sfc Obs Nocturnal Boundary Layer Rawinsondes Modeling Gap Surface Layer Building Urban Storm Fronts Synoptic 1 mm 1 cm 1 m 10 m 100 m 1 km 10 km 100 km 1000 km Slide modified after Walter Bach, ARO Horizontal grid spacing
Mixing Depth – Spatial and Temporal Variability SCOS-97 mixing depths, September 4, 1997 0300LST L.A. Basin (Plate, 2004) 1400LST (MacDonald et al., 2001)
Emergence of Urban-Based Mesoscale Initiatives • U.S. Weather Research Program PDT-10 on Urban Forecasting (1998) • U.S. Weather Research Program PDT-11 on Air Quality Forecasting (2001) and subsequent AQF Workshop (2003) • U.S. Weather Research Program Community Workshop on Multifunctional Mesoscale Observing Systems (2003) • U.S. Environmental Protection Agency Recommendations on Air Quality Forecasting and the Role of Urban Testbeds (2004) • Helsinki Mesoscale Testbed (in operation since 2005) • U.S. National Academies’ Panel on Multi-Functional Mesoscale Networks (midway through an 18-month study; completion 1Q 2008) • U.S. Multi-Agency New Study of Urban Meteorological Testbeds (ongoing; completion 1Q 2008) • American Meteorological Society’s New Panel on Partnerships and Mesoscale Networks (midway through an 18-month study; no completion target as yet) • Canadian Research on Improved Urban Weather and Air Quality Forecasting (started in 2006 a 3-Year Study) • U.S. National Science Foundation Study on Urban Meteorology (started a 5-year study in 2006) • Beijing Mesoscale Network (in advanced implementation stage) • London Mesoscale Network (in early planning stage)
One Very Relevant Study of the US Weather Research Program BAMS 86(7), 2005
Recommendations re: Modeling & Data Assimilation Observational Recommendations from the Modeling & Data Assimilation Community (mesoscale workshop) Observational Recommendations from the Modeling & Data Assimilation Community • Current observations are not sufficient for mesoscale applications. The following observations are needed to most effectively addressdeficiencies in current observing networks: • More accurate precipitation rates with good quality control; • Three-dimensional hydrometeor fields; • Three-dimensional mass, wind, and moisture fields • 10-km horizontal resolution in the lower troposphere • 10-100 km in the upper troposphere; • Three-dimensional cloud fields and cloud diabatic heating rate profiles; • Daily land (sea) surface features • Soil moisture and temperature profiles, • Snow cover and depth, • Land and sea-surface temperature (SST), • Emissivity • Vegetation type and state; • Turbulent flow, fluxes, and stability measured from Earth’s surface to 2 km • 15 min. intervals and 100-200m vertical resolution; • PBL height and characteristics of convective rolls; • Tropopause topology with 10 km horizontal resolution; • O3, CO2, water vapor, & cloud distributions req’d for radiative transfer models; • Aerosols and chemical tracer concentrations • 3D high-resolution fields • Precipitation, hyrdometeors and clouds • Surface characterization • PBL structure • Chemical species and PM • Testbeds are crucial
Recommendations re: Nowcasting Observational Recommendations from the Nowcasting Community (mesoscale workshop) Observational Recommendations from the Nowcasting Community (from the Mesoscale Workshop) • Top mesonet recommendation: • Establish a national mesonetwork of surface stations. NOAA should take the lead to establish this network, and set standards for data quality. Resolution needed: <10-25km and 5-15min. • Remote sensing recommendations: • Addition of dual polarization capability to the WSR-88D network. • Pursue integration of other radars into the national radar network. • Investigate improving boundary-layer coverage through the use of closely spaced X-band radars. • Vigorously pursue national expansion of the NOAA Profiler Network with emphasis on boundary-layer observations. • Test the utility of radar refractivity measurements to improve nowcasting.
Recommendations re: Nowcasting Observational Recommendations from the Nowcasting Community (mesoscale workshop) Observational Recommendations from the Nowcasting Community (from the Mesoscale Workshop) • Other priority recommendations: • Conduct research aimed at using total lightning datato improve severe weather warnings and nowcasts. • Demonstrate added value of high-resolution water vapor fields for improve nowcasting. • Establish testbeds for very short period forecasting (0-6 hr, nowcasting) of high-impact weather. Tasks should include: • siting recommendations; • identification of leveraged funding sources; • identification of public/private partners; • specification of nowcasting systems and products; • involvement of potential clients and users; and • conducting impact and benefits studies.
Recent Supporting Studies of the USWRP Two Other Relevant USWRP Studies on AQF BAMS 87(2), 2006
Scope of AQF Workshop Recommendations Organization of Recommendations Recommendations focus equally on measurement & modeling BLD = Boundary-layer Dynamics WG C&A = Clouds and Aerosols WG M&M = Measurements and Modeling WG OAQF = Operational Air Quality Forecasting WG S&SI = Stakeholders and Societal Impacts WG
Some Specific Recommendations from the USWRP AQF Workshop (29 April - 1 May 2003) U+ extremely urgent U urgent I important
Presentation Outline • Urban Demographics & Challenges • Importance of the PBL • Measurement Systems • Mesoscale Networks and Testbeds
Measurement Technology & Environmental Prediction Observations Science Improved atmospheric measurements are central to improved environmental analyses and forecasts Computing Modeling
Candidate Measurement Systems • Weather radar: reflectivity; velocity, polarization; refractivity • Wind profilers: radar, sodar; lidar; tethersondes; aircraft • Thermodynamic soundings: RAOBS, aircraft; tethersondes; lidar • Lightning detection: CG; total • Radiometers: microwave -- scanning; multi-wavelength • GPS receivers: precipitable water vapor -- column integrated; maybe slant path and 3D • Surface mesonets: PTU; V; LW, SW, net radiation; energy & momentum fluxes • Satellites: geostationary; POES; LEO
WSR-88D Radar Network Coverage – PBL Limitations • Elevation angles between 0.5 and 20 degrees • Earth surface curvature effect • “Cone of silence” & “pyramid of silence” • Much less coverage at the low levels/in PBL where features such as thunderstorm outflows, convergence boundaries are crucially important • Resolution degrades further away from radar • ~75-85% of PBL is not observed CONE OF SILENCE 20deg PYRAMID OF SILENCE 0.5deg Courtesy of: Fred Carr, Univ. Oklahoma
CASA Price target equivalent to a mid-to-high-end automobile
Mixing Depth – Data and Methods Mixing Depth – Radar Wind Profiler Estimating Mixing Depth Cn2 Vertical Velocity Spectral Width 0 local time 24
Mixing Depth – Ceilometer vs. RAOB Sounding (2000) CT25K Backscatter 28-29-Mar-2000 CT25K Backscatter 29-Mar-2000 @ 11:44 3000 2000 Radiosonde Sounding 29-Mar-2000 @ 11:44 2500 1800 2000 1800 1600 2000 1600 1400 Altitude (m) 1500 1400 1200 Altitude (m) 1000 1200 Altitude (m) 1000 1000 500 800 800 0 600 10 12 14 16 18 20 22 0 2 4 6 8 10 12 14 16 18 20 22 0 600 Local Time (h) 400 400 200 200 0 0 2 3 4 10 10 10 0 5 10 Backscatter (a.u.) Potential Temperature (°C) 1m CT25K BSL
Summary of Selected Mesoscale/Urban Challenges • PBL observations with high vertical and temporal resolution • radar wind profilers • lidars & laser ceilometers • x-band radars • aircraft • Dynamic characterization of land surface • Acquire & assimilate 4D meteorological and chemical data • High-resolution surface networks: <10km and 5min resolution • Augmentation of weather radar network • dual polarization • radars of opportunity • high-density, low-power radar networks • total lightning observations – merge with radar data • adaptive radar calibration • Testbeds -- a vehicle to evaluate alternative measurement, modeling and implementation strategies • Optimal network design
Presentation Outline • Urban Demographics & Challenges • Importance of the PBL • Measurement Systems • Mesoscale Networks and Testbeds
Some Definitions Mesoscale networks measure the three-dimensional, time-dependent structure of the lower atmosphere using an integrated observing system that incorporates in situ and remote sensing systems, deployed on/from the ground and aloft. “Mesonets” are a subset of mesoscale networks that consist of high-density surface stations. APPLICATION
General applications • Analysis/description of current atmospheric state – research or ops • Nowcasting/very short-range forecasting (0+ to ~2 hrs) • Short-range mesoscale prediction (~3 to 48 hrs) mesoscale prediction Schematic illustration As the timescale of the prediction increases, so does the commonality of the observing systems needed to make the prediction (i.e. they become less application-specific). As the timescale of the prediction decreases -- toward analysis and short- term nowcasting – the observing requirements become more application-specific Area (rel.) nowcasting Site of interest Time (rel.) analysis
Mesoscale Weather Forecasting -- Testbeds • Testbed Definition: “A working relationship in quasi-operational framework among forecasters, researchers, private-sector, and government agencies aimed at solving operational and practical regional problems with a strong connection to end-users.”